Every visual inspection system makes two kinds of mistakes. The first: it passes a defective part — a False Acceptance (FA), also called a defect escape. The second: it fails a good part — a False Rejection (FR), also called overkill. These two error types have fundamentally different consequences, cost completely different amounts of money, and pull the system in opposite directions when you try to reduce them.
Understanding FA and FR — what causes them, how they trade off, and how AI’s pixel-level segmentation changes the level of control available to quality engineers — is essential for anyone evaluating or deploying an AI visual inspection system. This article explains both metrics in depth, quantifies their real manufacturing cost, and describes how to balance them in practice using CorteX’s capabilities.
Key Takeaways
- False Acceptance (FA) = a defective part passes inspection — the consumer risk. Consequences include escapes to customers, recalls, safety incidents, and OEM supplier deratings.
- False Rejection (FR) = a good part fails inspection — the producer risk. Consequences include unnecessary scrap, rework costs, reduced yield, and wasted production capacity.
- FA and FR trade off against each other — tightening detection to reduce FA increases FR, and vice versa. The goal is to find the optimal operating point, not to minimize one in isolation.
- Pixel-level segmentation gives AI inspection a key advantage: instead of a binary pass/fail based on bounding boxes, it provides defect size and morphology data that enables precise control of the FA/FR balance for each defect class.
Definitions: FA and FR in a Manufacturing Context
False Acceptance (FA) — The Escape
A False Acceptance occurs when an inspection system classifies a defective part as acceptable. The defective part passes through inspection and continues downstream — potentially being assembled into a finished product, shipped to a customer, or incorporated into a safety-critical component.
In quality engineering terminology, this is the consumer risk: the risk that the customer receives a defective product. The formal rate metric is the False Acceptance Rate (FAR), defined as the number of defective parts incorrectly passed divided by the total number of defective parts inspected.
Target FA rates in UnitX deployments:
- Critical structural or safety defects: Target 0% (zero tolerance — near-zero FA)
- Cosmetic or functional defects: ≤ 0.1% or per customer specification
False Rejection (FR) — Overkill
A False Rejection occurs when an inspection system classifies a conforming, good part as defective. The good part is removed from the production flow — typically scrapped, reworked, or flagged for manual re-inspection — consuming resources unnecessarily.
This is the producer risk: the manufacturer bears the cost. The False Rejection Rate (FRR) is defined as the number of good parts incorrectly failed divided by the total number of good parts inspected. In traditional rule-based machine vision systems, FR rates of 5–15% or higher are common on complex or variable parts — a direct driver of yield loss and OEE degradation that is often invisible in quality reporting because it appears as scrap rather than an inspection system error.
The FA / FR Tradeoff: Why It’s Hard to Minimize Both at Once
This is the central tension in inspection system design. Any detection threshold that defines the boundary between “accept” and “reject” creates a direct tradeoff between FA and FR. When you tighten the threshold — requiring higher defect confidence before accepting a part — you catch more defects (lower FA), but you also flag more borderline good parts as defective (higher FR). Loosening the threshold reduces FR, but FA increases.
This tradeoff is visualized through the Receiver Operating Characteristic (ROC) curve, which traces the FA/FR operating points as the threshold is varied from zero to one. The ideal detection system has a curve that hugs the upper-left corner — achieving near-zero FA and near-zero FR simultaneously. In practice, every system has a curve with some slope, and the question becomes where on that curve the production team sets the operating threshold.
The critical insight for manufacturing is this: the shape of the ROC curve is determined by the underlying detection technology, but the operating point on that curve is a business decision. A safety-critical automotive component (where FA consequences include recall liability) demands a very different threshold than a cosmetic surface blemish on an interior trim piece (where FR consequences include unnecessary scrap of an expensive formed part).
The Real Cost of FA and FR: Two Very Different Damage Types
The Cost of a False Acceptance
FA consequences scale with both the severity of the defect and how far downstream the escape occurs. A defect caught immediately after the inspection station costs almost nothing to address. The same defect, discovered after it has been assembled into a finished unit and shipped, can cost orders of magnitude more.
In automotive manufacturing, a single escape that triggers a recall event has well-documented costs: direct recall execution often runs into the tens of millions of dollars, in addition to OEM supplier derating that can impact future business. In EV battery manufacturing, an internal short-circuit defect escaping into a finished battery pack introduces safety liability that is categorically different from standard product quality issues. Even short of recalls, defects that reach OEM customers are tracked through supplier quality scoring systems — a poor escape rate directly affects future sourcing decisions.
Manual visual inspection, the benchmark most manufacturers are replacing, operates at approximately 80% accuracy under typical production conditions, according to research published in MDPI’s Machines journal — meaning roughly 1 in 5 defective parts is missed at manual inspection speeds. AI visual inspection, particularly with pixel-level deep learning segmentation, achieves up to a 9× lower escape rate compared to human operators in UnitX customer deployments. This magnitude of FA improvement is what drives ROI for most AI inspection projects.
The Cost of a False Rejection
FR consequences are quieter but financially significant, particularly at scale. A 5% FR rate on a line producing 10,000 parts per day means 500 good parts scrapped or reworked daily. If each part costs $15 to manufacture to that point in the process, that equates to $7,500 per day in yield loss — $2.7 million per year per line — from an inspection system error that does not appear as a “defect escape” in quality reporting.
Beyond direct scrap costs, high FR rates degrade OEE through the quality rate component, create additional rework labor, and — critically — erode operator trust in the inspection system. When too many good parts are rejected, operators begin to override or bypass the system. An inspection system that performs well on paper but suffers from overkill in practice is not delivering the level of quality assurance it appears to provide.
Rule-based machine vision systems are particularly prone to high FR on parts with natural surface variation — material batch changes, subtle texture differences, and reflectance variation across a batch. Rules tuned to detect a specific defect feature often also capture legitimate variation, generating false alarms. This is a core reason why traditional machine vision frequently exhibits higher FR rates than AI-powered systems on the same parts.
Why Pixel-Level Segmentation Changes the FA/FR Balance
The fundamental limitation of legacy rule-based detection for FA/FR control is its lack of granular spatial awareness. A rigid rule might trigger a failure because a cluster of pixels crossed a basic contrast threshold somewhere in a region, but it cannot determine the defect’s exact size, precise boundary, or morphological characteristics.
This coarse output makes detection tuning incredibly imprecise. You cannot reliably distinguish a harmless 0.2mm scratch (cosmetically insignificant) from a 2mm crack (potentially catastrophic) based on a basic rule definition alone.
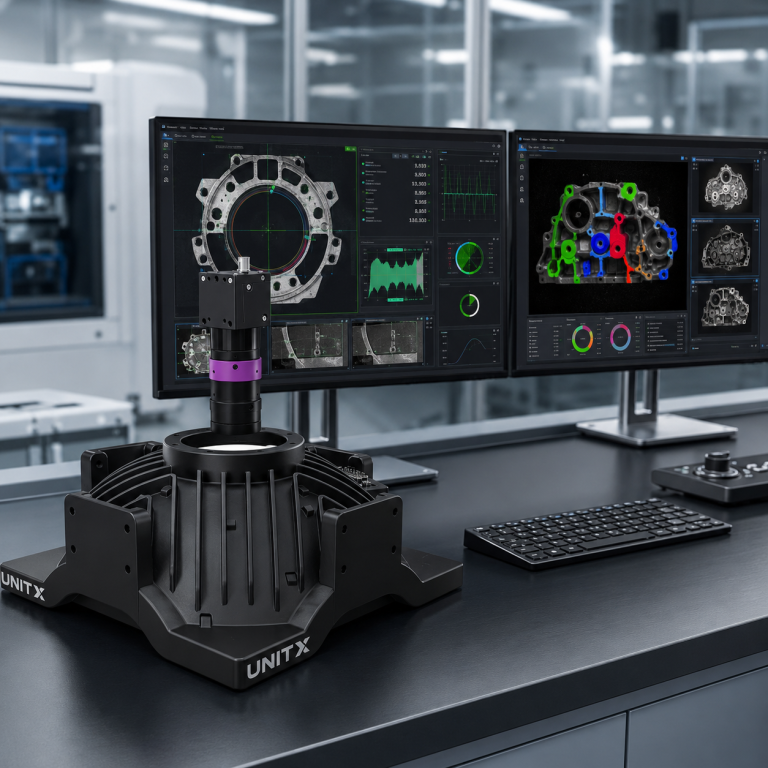
CorteX’s deep learning segmentation fundamentally changes this dynamic by providing pixel-level defect boundaries. For every detected defect, the system captures its exact area in pixels (which can be translated into physical dimensions), precise location on the part, morphological class (e.g., scratch vs. pit vs. crack), and pixel-level confidence.
- Cracks of any length: reject (FA = 0, FR acceptable cost)
- Scratches > 5mm in functional surface areas: reject
- Scratches ≤ 5mm in non-functional areas: accept (reducing FR without increasing FA on critical defects)
- Surface staining outside visible zone: accept (cosmetic tolerance)
These defect-type and size-aware acceptance criteria are only possible when the inspection system outputs rich, pixel-level segmentation. They are structurally impossible with basic bounding-box AI and entirely out of reach for traditional rule-based machine vision systems that return only a binary pass/fail without deeper defect characterization.
Ultimately, the ability to selectively [configure CorteX detection] thresholds per defect class is what allows UnitX deployments to achieve near-zero FA on critical defects while simultaneously reducing the FR (overkill) that legacy systems often produce.
FA and FR Performance Targets: By Industry
| Industry | Defect Type | FA (False Acceptance) Target | FR (False Rejection) Priority |
| Automotive Tier 1 (structural) | Cracks, voids, weld defects | 0% (Zero Tolerance) | Secondary — cost of FR is lower than escape liability |
| Automotive (cosmetic surface) | Scratches, staining on visible surfaces | ≤ 0.5% | High — expensive formed parts, FR creates scrap cost |
| EV Battery (cell level) | Tab weld defects, dendrites, coating anomalies | 0% for critical safety defects | Moderate — cell cost is high, but safety liability is higher |
| PCBA (functional components) | Missing components, cold solder joints | ≤ 0.1% | High — board rework is expensive; avoid unnecessary reflow |
| Consumer electronics (cosmetic) | Surface blemishes on visible housing | ≤ 1% (per customer grade spec) | High — high-volume, low-margin; overkill at 1% on 1M units/month is significant |
How to Set FA/FR in Practice
Establishing acceptance criteria is an iterative process, not a one-time configuration.UnitX follows a structured methodology in every deployment:
Step 1: Classify Defects by Severity
Before training any model, define defect severity tiers: Critical (never escape), Major (low FA tolerance, FR acceptable), and Minor (cosmetic tolerance, low FR priority). This classification determines which defect classes require zero-tolerance FA targets and which can be optimized for FA/FR balance.
Step 2: Train with Representative Defect and Non-Defect Examples
Model accuracy sets the ceiling on achievable FA/FR performance. A model trained on a narrow defect sample that does not represent the full morphological range will have a suboptimal ROC curve, regardless of threshold settings. This is where few-shot learning and FleX-Gen synthetic data augmentation improve the baseline before threshold tuning begins.
Step 3: Evaluate on a Validation Set with Known Labels
Run the trained model against a labeled validation set. Plot the confusion matrix across multiple sensitivity levels. At each operating point, record the FA count, FR count, and the specific defect types contributing to each error. This generates the empirical FA/FR tradeoff curve for that specific production part.
Step 4: Set Operating Thresholds per Defect Class
Using CorteX’s threshold interface, set separate thresholds for each defect class based on severity. Critical defects receive conservative thresholds that minimize FA, even at the cost of higher FR. Minor cosmetic defects receive more permissive thresholds that minimize FR while maintaining acceptable FA levels.
Step 5: Monitor and Refine in Production
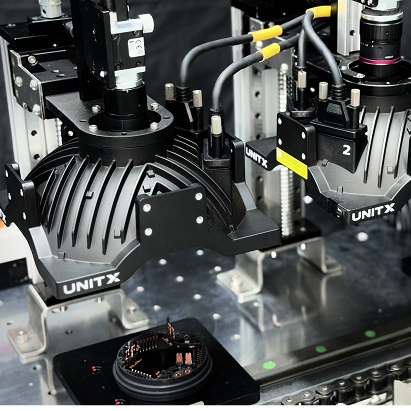
Production conditions introduce variation not always present in the training set — new material batches, lighting changes over time, and seasonal temperature effects. CorteX provides real-time monitoring of FA and FR rates, with alert thresholds that flag when either metric drifts beyond target levels. When drift is detected, the model is updated with new production examples and redeployed — typically within the same shift.
Learn how CorteX’s AI platform enables precise, per-class threshold control for FA and FR management across production lines.
Frequently Asked Questions
What is the difference between False Acceptance and False Rejection in quality inspection?
False Acceptance (FA) means a defective part passes inspection and enters the production flow or reaches the customer — this is the escape risk, with consequences including recalls, safety incidents, and customer returns. False Rejection (FR) means a conforming part is incorrectly failed by the inspection system — this is the overkill problem, leading to unnecessary scrap, rework costs, and reduced production yield. Both are errors, but FA consequences are typically more severe in safety-critical manufacturing.
Can an AI inspection system achieve zero FA and zero FR simultaneously?
In practice, no inspection system — AI or otherwise — achieves absolute zero on both metrics simultaneously. What AI inspection with pixel-level segmentation achieves is a significantly better FA/FR tradeoff curve than rule-based machine vision: lower FA at the same FR level, or lower FR at the same FA level. For critical defect classes (e.g., structural cracks or battery safety defects), near-zero FA is achievable at the cost of slightly higher FR, which is the correct tradeoff in those applications.
Why is my inspection system rejecting too many good parts?
High FR — overkill — typically has three root causes: thresholds set too conservatively ( low confidence required to trigger rejection), insufficient representation of natural surface variation in the training data (the model cannot distinguish normal variation from defects), or inconsistent imaging that the model interprets as anomalies. Resolving this requires identifying which defect class is driving false alarms, verifying that labeling boundaries accurately distinguish defects from normal variation, and adjusting per-class thresholds accordingly.
How does UnitX measure FA and FR in production?
CorteX tracks FA and FR rates continuously through its production data dashboard. FA is measured through periodic audits of passed parts — samples of OK-classified parts are manually reviewed to identify missed defects. FR is tracked through review of rejected parts — NG-flagged parts are spot-checked to determine how many were genuinely defective vs. falsely flagged. These audit samples feed back into the model refinement cycle, improving accuracy over time as the model is retrained on real production data.
Explore the UnitX FleX platform — or talk to UnitX experts to see how CorteX’s pixel-level segmentation enables precise FA/FR threshold control for your production environment.