Every capital investment decision in manufacturing comes down to the same question: Does this investment generate more value than it costs, and how quickly? AI-powered visual inspection is no different. Yet most ROI calculations we encounter during vendor evaluations are either too optimistic, built on best-case assumptions without production validation, or too narrow, counting only labor savings while ignoring the larger cost categories that drive the real financial case.
Quality Digest research documents COPQ (Cost of Poor Quality) ranges from 5% to 30% of gross sales for manufacturing companies. For a facility generating $25 million annually, that translates to $1.25 million to $7.5 million in avoidable quality costs every year.
This guide provides the five-bucket ROI framework we use with every customer who asks us to quantify the financial case of AI-powered visual inspection on their production line. The same framework applies whether the facility manufactures automotive components, battery cells, semiconductor packaging, or precision connectors.
Key Takeaways
- COPQ is the starting point, not labor savings. Most plants underestimate COPQ by 50% or more. A complete cost baseline includes scrap, rework, warranty claims, inspection overhead, and management time, not just inspector headcount.
- Five cost buckets drive the ROI case. Labor, scrap, defect escapes, rework, and throughput. Each contributes measurable value. Counting only one or two understates total returns by 60% or more.
- The UnitX benchmark for automotive Tier 1 lines is $1.3M annual ROI per line, with a payback period of less than 12 months (UnitX customer data, 2025).
- A 30-minute model training cycle means time-to-value is measured in days, not months, helping shorten the payback period compared to legacy inspection projects.
Step 1: Establish Your COPQ Baseline
Before projecting AI inspection returns, a plant must understand what quality failures currently cost. Most quality teams know their scrap rate and rework hours. Few have a complete COPQ figure that includes external failure costs such as warranty claims, customer returns, and recall expenses. Autodesk’s manufacturing research notes that, in mature operations, COPQ can account for as much as 15% to 20% of total sales. However, much of it is hidden in overhead accounts that finance teams do not directly attribute to quality.
The COPQ calculation includes four categories. Internal failure costs cover scrap material, rework labor, re-inspection time, and machine downtime caused by quality issues. External failure costs cover warranty claims, customer returns, recall expenses, and the disposition of returned goods. Appraisal costs cover the labor and equipment required to run manual inspection lines. Prevention costs cover quality engineering time, training, and gauge calibration.
For an AI inspection ROI calculation, the most relevant categories are internal failure costs (scrap and rework), external failure costs (warranty claims and returns), and appraisal costs (inspector labor), since AI inspection directly reduces all three while shifting spending toward prevention.
Step 2: Quantify Defect Escape Savings
Defect escapes, parts that pass inspection and reach downstream assembly or the customer, carry the highest cost per unit of any quality failure. A defect caught at the inspection station costs only the material value of the part. The same defect discovered during customer incoming inspection costs the material value plus logistics and administrative disposition costs. If discovered in the field after delivery, the same defect may cost 10x to 100x the original part value due to warranty claim administration, field service, and brand damage.
We have documented a 9× reduction in defect escapes at UnitX customer sites compared to manual inspection baselines (UnitX customer data, 2025). To translate this into financial impact, multiply your current annual warranty and return costs by the expected reduction in escape rates. A plant spending $300,000 per year on warranty disposition for defects that passed inspection could recover $200,000 to $270,000 annually from a 9× reduction in escapes.
Research from MDPI Engineering Proceedings confirms that AI-based inspection delivers statistically superior defect detection accuracy compared to traditional methods, which is the underlying mechanism driving this reduction.
When this defect escape data is considered alongside Infosys’s yield improvement analysis in semiconductor manufacturing, which estimates that a 1% yield improvement produces approximately $150 million in profit per major facility, a structural insight emerges: the benefits of escape reduction compound nonlinearly as production volume increases.
For a high-volume line producing 1,200 parts per minute, even a fractional reduction in escape rate can translate into hundreds of avoided warranty incidents per month. At high-volume plants, ROI from escape reduction alone often exceeds the total system cost within the first year.
Step 3: Quantify Labor and Overhead Savings
Labor savings are the most straightforward component of the AI inspection ROI calculation. Count the full-time equivalent (FTE) inspectors currently assigned to the line, multiply by fully loaded labor cost (salary, benefits, training, and overtime), and apply the fraction of time the AI system replaces.
In our deployments, we typically see 2 to 4 FTE redirected from repetitive visual inspection tasks to higher-value quality engineering and root-cause analysis roles per production line.
At a fully loaded cost of $65,000 to $80,000 per FTE in North American automotive Tier 1 environments, redirecting two FTEs represents $130,000 to $160,000 in annual labor reallocation value. Redirecting four FTEs represents $260,000 to $320,000 annually.
We do not position this as “headcount reduction” in the business case. Instead, we characterize it as workforce augmentation, freeing inspectors to focus on root-cause analysis and process improvement work that manual inspection often prevents them from doing. UnitX’s deployment model is built around this augmentation approach: AI inspection enables quality engineers to focus on work that requires engineering judgment.
Step 4: Quantify Scrap and Rework Savings
Scrap savings in AI inspection come from two primary mechanisms.
The first is earlier defect interception. Defects caught at the earliest detection point incur only the material value added up to that stage. Defects that move further through the process accumulate additional labor and material costs. AI inspection deployed at the right process checkpoints intercepts defects before significant value is added, reducing the total scrap cost per defective unit.
The second mechanism is false rejection (FR) rate reduction. Rule-based machine vision systems frequently reject good parts at high FR rates (5% to 15% is common for complex parts) in order to avoid missing real defects. Every false rejection creates a scrap or rework event that consumes material, labor, and production time.
We target a false rejection rate of ≤1% in our deployments, compared to the 5% to 15% range typical of legacy rule-based systems. On a line producing 500,000 parts per year, reducing FR from 7% to 1% recovers 30,000 good parts annually. At a material cost of $10 per part, that equates to $300,000 in recovered yield before accounting for labor or rework savings.
Combined with the escape reduction data above, customers across automotive inspection and connector inspection lines consistently report scrap reductions of approximately 3% within the first year (UnitX customer data, 2025).

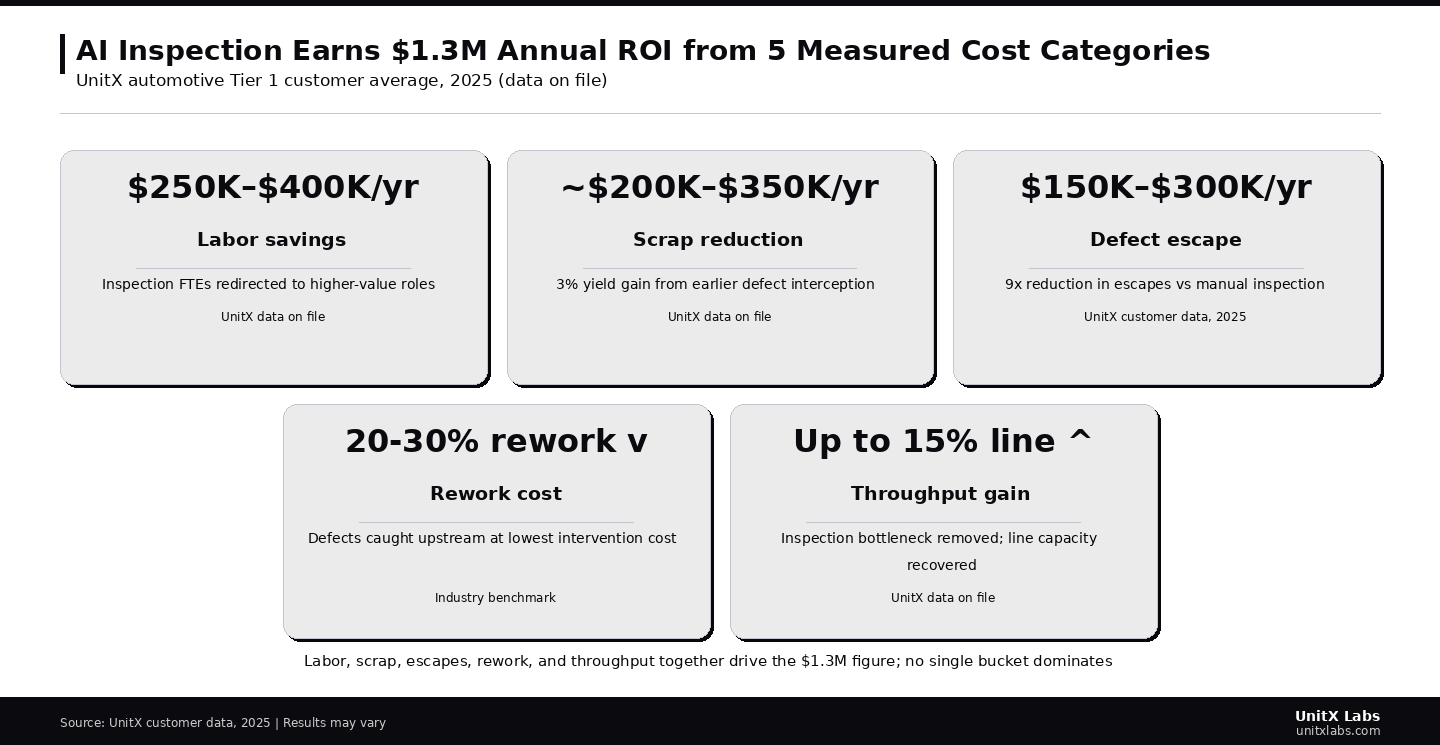
Labor, scrap, defect escapes, rework, and throughput together drive the $1.3M annual ROI figure; no single category dominates the business case.
Step 5: Model Throughput Gains and Build the Payback Calculation
Throughput gains from AI inspection come from two primary sources: removing inspection bottlenecks and reducing line stoppages caused by quality-related events.
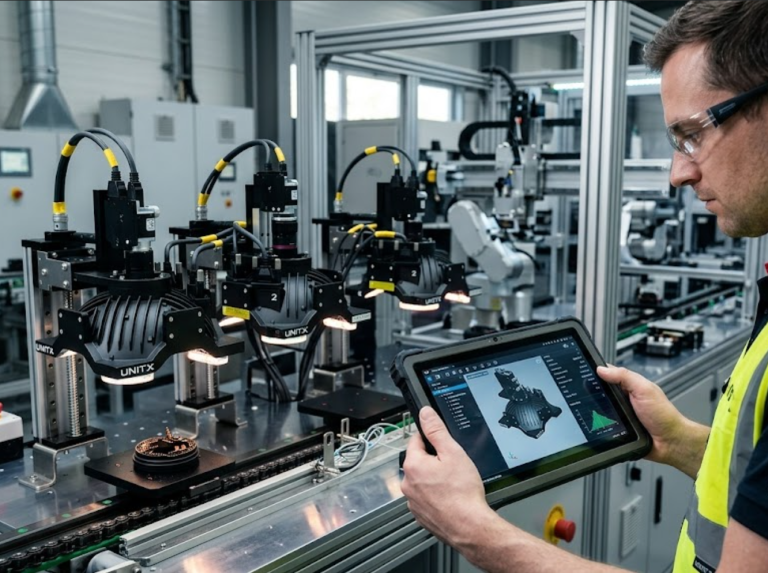
Manual inspection stations are frequently cycle-time limiters, particularly on high-mix lines where part variation requires inspectors to make complex judgment calls under time pressure. AI inspection running at 100 MP/s inference on CorteX maintains full production speed regardless of part variety.
To model throughput value, estimate the percentage of shift time currently lost to inspection-related pauses, judgment calls, and supervisor escalations. For a plant operating two shifts at $500 per hour of production value, recovering 2% of production time translates to approximately $1,500 per day, or roughly $375,000 annually.
This figure varies significantly by industry and line type, but it consistently acts as a secondary contributor to the overall ROI calculation.
The payback period calculation follows a standard formula. Total cost of ownership (TCO) includes hardware, software, installation, integration, and first-year maintenance. Annual returns are calculated as the sum of the five categories described above: labor reallocation, scrap and rework reduction, defect escape savings, and throughput recovery.
Payback period equals TCO divided by annual returns.
Our customers have consistently achieved payback periods of less than 12 months (UnitX customer data, 2025), driven by the combination of a 7-day SAT timeline and the high return density of the five-bucket ROI model.
Worked Example: Mid-Size Automotive Tier 1 Line
A production line manufacturing 500,000 stamped metal parts per year, currently operating with 4 manual inspectors and spending approximately $280,000 annually on warranty claims from field escapes, provides a representative scenario.
The COPQ calculation yields approximately $420,000 per year in internal failure costs (scrap: $280,000; rework: $140,000), $280,000 in external failure costs (warranty claims), and $260,000 in appraisal costs (4 FTEs). The total COPQ baseline is therefore approximately $960,000 per year.
Applying the five-bucket model to this scenario:
- Labor reallocation of 3 FTEs at a fully loaded cost of $75,000 recovers $225,000 annually.
- A 3% scrap reduction and a 70% FR rate improvement recover $195,000 in scrap and rework savings.
- A 9x reduction in defect escapes applied to the $280,000 warranty baseline recovers $252,000.
- A throughput gain equivalent to 1.5% of shift time recovers approximately $95,000.
Total annual return: approximately $767,000.
At a system total cost of ownership (TCO) of $450,000 for a single-line AI inspection deployment, the payback period is approximately 7 months. This aligns with the broader portfolio average of under 12 months that we report across customers (UnitX customer data, 2025).
To build a site-specific business case using your plant’s actual COPQ data, book a session with a UnitX expert. We provide a structured ROI worksheet based on this five-bucket framework using your production data, defect rates, and labor costs. We can also reference relevant UnitX case studies from your industry to help anchor the projections.
Market data from MarketsandMarkets confirms that the machine vision quality inspection segment is growing at a 13% CAGR through 2030, driven by the ROI case outlined here. IEEE’s assessment of AI in manufacturing similarly notes that production-scale AI deployments, not experimental pilots, are delivering the yield and quality improvements that justify the investment.
Frequently asked questions
What is the typical payback period for AI inspection?
Across our customer portfolio, the typical payback period is under 12 months (UnitX customer data, 2025). The fastest payback periods, typically between 5 and 8 months, occur on high-volume lines where defect escape costs and false rejection rates are highest.
Longer payback periods, typically between 10 and 14 months, occur on low-volume, high-mix lines where throughput and labor savings are smaller, although scrap and defect escape reductions still provide meaningful financial returns.
Should manual inspection costs be included in the ROI calculation?
Yes. The appraisal component of COPQ, inspector labor and overhead, is one of the most visible and defensible line items in the business case.
Include fully loaded labor costs, not just base salary, because overtime, training, benefits, and management time are also reduced when AI inspection absorbs repetitive inspection work.
Market data from Fortune Business Insights shows that advanced manufacturing sectors with the highest AI inspection ROI are also experiencing the fastest growth in advanced packaging markets, reinforcing the relationship between inspection investment and manufacturing competitiveness.
How do I account for deployment costs that are hard to estimate?
Use a conservative TCO multiplier of 1.3x over the quoted system price to account for integration labor, PLC engineering time, MES connectivity development, and first-year maintenance.
In our experience, this provides a conservative buffer. The 7-day SAT timeline significantly reduces integration labor compared to multi-week legacy system installations, and the MES integration protocols we deploy are based on standard industrial APIs with documented integration patterns for common MES and PLC platforms.
Research published in the International Journal of Advanced Manufacturing Technology also shows that integrated machine vision systems consistently outperform custom-built alternatives in total deployment cost and time-to-production metrics.