By UnitX Applications Engineering Team, Applications Engineering at UnitX · March 2026 · 10 min read
One of the most common misconceptions about AI visual inspection is that it works like a person reviewing photos on a screen — you show it an image, wait a moment, and eventually it tells you whether the part is good. The reality is a tightly choreographed sequence of hardware and software operations that begins before the part arrives at the inspection station and completes with a digital signal to your PLC before the part exits the field of view.
Understanding this pipeline — each stage, what it does, where latency accumulates, and how the output connects to your line control system — is essential for production engineers evaluating inline AI inspection. This walkthrough covers the complete chain from physical part to OK/NG decision, using UnitX FleX as the reference implementation.
Key Takeaways
- Inline inspection runs at production speed — no stopping, no slowing down the line. The entire cycle from trigger to PLC output completes in milliseconds.
- Imaging quality determines AI quality. The most sophisticated inference model cannot compensate for poorly illuminated or blurred images — hardware and software must be designed together.
- Fly capture mode enables inspection of parts moving at up to 1.0 m/s without motion blur, using precisely timed strobed illumination.
- The OK/NG decision outputs as a standard digital signal that integrates with any PLC or rejection system via 20+ industrial protocols — no custom integration work required.
Stage 1: Part Presence Detection and Trigger
The Trigger Signal
Every inline inspection cycle begins with a trigger. When a part enters the inspection station’s field of view, a photoelectric sensor or proximity sensor generates a signal that initiates the imaging sequence. The timing precision of this trigger is non-trivial: on a high-speed line running at 1,200 parts per minute, the window in which the part is correctly positioned and must be imaged is approximately 50 milliseconds. A late trigger means a blurred or mis-framed image; a missed trigger means an uninspected part passes through.
In fly capture (continuous conveyor) configurations, the trigger logic must account for conveyor speed — activating the strobe illumination at the precise moment when the part is centered in the field of view. OptiX’s control hardware interfaces directly with the line encoder, using conveyor position feedback to compute trigger timing dynamically, rather than relying on fixed time delays that drift as line speed varies.
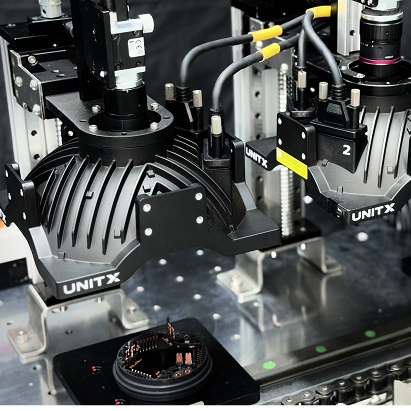
Multiple Inspection Angles
Many part geometries require inspection from more than one angle — a turned shaft needs both top-surface and cylindrical surface inspection; a stamped bracket needs both face and edge views. Multi-camera configurations capture all required views in a single pass. Trigger synchronization across multiple cameras ensures all views are captured within the same inspection window, so downstream AI inference receives a complete multi-view image set for every part.
Stage 2: Illumination and Image Acquisition
Why Lighting Is the Critical Variable
In industrial inspection, lighting isn’t ambiance — it is a precision instrument. The contrast between a real defect and a normal surface feature often amounts to a difference of 5–15 gray levels in an 8-bit image. Whether that difference is visible at all depends entirely on illumination angle, wavelength, intensity, and whether the lighting is consistent from frame to frame.
Fixed conventional lighting — a ring light or a bar light at a single fixed angle — illuminates some defect types reliably and misses others entirely. A scratch running parallel to the light direction may be nearly invisible; the same scratch perpendicular to the light direction generates a sharp shadow. On a production line where parts arrive with random orientation or surface variation, fixed lighting creates systematic blind spots.
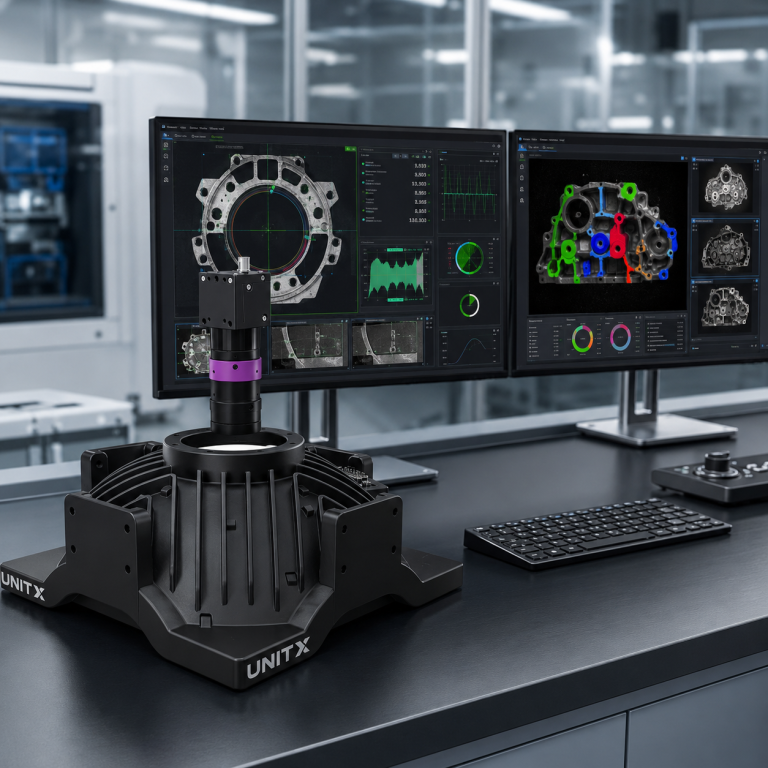
Software-Defined Illumination: OptiX Architecture
OptiX addresses this with 32 independently controllable LED channels arranged around the imaging field of view. Rather than using a fixed illumination configuration, OptiX can switch through up to 50 different lighting schemes per second — each a unique combination of active channels, intensities, and timing — capturing multiple images of the same part under different illumination conditions in a single inspection pass.
This means a single part can yield, for example, four images: coaxial (surface reflection), low-angle dark field (surface topology), side-lit (edge features), and 2.5D structured light (depth map). The AI inference model receives all four as inputs, with access to information about surface appearance, texture, and geometry that no single-lighting system can provide. The 100× brightness advantage over conventional light sources ensures sufficient signal-to-noise ratio even at 1.0 m/s fly capture speeds, where effective exposure times are in the sub-millisecond range.
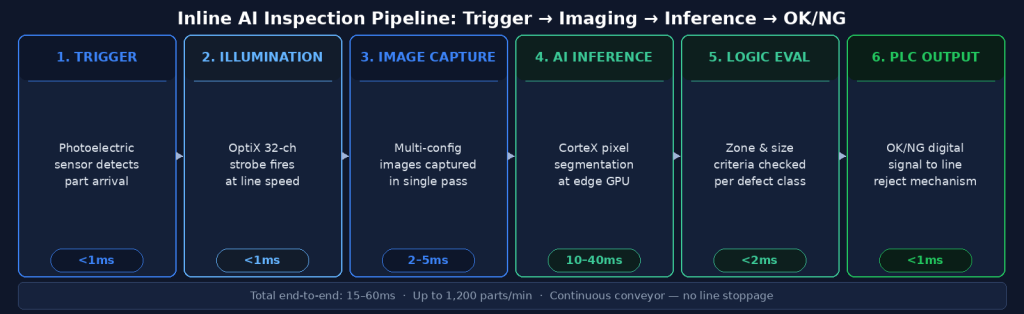
The complete inline inspection pipeline from part trigger to PLC reject signal. Total cycle time is typically 15–80ms depending on image resolution and model complexity.
Stage 3: AI Inference — From Pixels to Defect Classification
Edge Inference Architecture
Once images are captured, they are transferred to the inference engine — in UnitX’s case, CorteX Inference running on edge GPU hardware co-located at the inspection station. Edge inference is essential for inline applications: cloud-based inference would introduce 100–500ms of network latency, making it incompatible with production line decision cycles. Edge hardware performs the full AI inference locally, with no external network dependency.
CorteX Inference processes images at up to 100 megapixels per second, supporting throughputs of up to 1,200 parts per minute across a wide range of image resolutions. For context, a 5-megapixel image at 1,200 ppm requires inference to complete in approximately 50ms — well within the capability of modern edge GPU hardware running optimized deep learning models.
The Inference Output
The inference model outputs a pixel-level segmentation mask — every pixel in the image classified as one of: background, defect type A, defect type B, and so on. This mask is then processed by the acceptance logic engine, which evaluates configurable criteria:
- Does any defect pixel overlap with defined critical zones?
- Does the total area of any defect class exceed the configured threshold?
- Does the longest dimension of any detected defect exceed the size limit?
- Is the confidence score of any detection above the minimum threshold?
Each criterion is independently configurable per defect class and per inspection zone, giving QA engineers precise control over what constitutes a rejectable defect rather than relying on a single global sensitivity setting.
Stage 4: OK/NG Decision and PLC Output
Digital Signal Output
The result of the acceptance logic evaluation is a binary OK or NG decision, output as a digital signal to the line PLC within the inspection cycle time. This signal triggers the downstream rejection mechanism — whether an air blast ejector, a divert arm, a stop gate, or a marking system — before the part exits the inspection station.
CorteX supports 20+ industrial communication protocols including EtherNet/IP, Profinet, Modbus TCP, OPC-UA, and discrete I/O, covering virtually all PLC and SCADA platforms used in manufacturing environments. Integration does not require custom development — the protocol configuration is handled through the CorteX software interface.
Data Logging and Traceability
Beyond the OK/NG signal, every inspection generates a complete data record: timestamp, part ID (if encoder integration is configured), image files, defect mask, defect characteristics (class, area, location, confidence), and decision outcome. This data is stored locally and optionally synced to a central server via CorteX’s Central Management System, supporting full production traceability, trend analysis, and quality audits.
The Complete Cycle Time Budget
| Pipeline Stage | Typical Duration | Key Variables |
|---|---|---|
| Trigger detection | < 1ms | Sensor type and response time |
| Strobe illumination + image capture | 1–5ms per image | Number of lighting schemes, camera resolution |
| Image transfer to inference engine | 2–10ms | Image size, interface bandwidth |
| AI inference (segmentation) | 10–40ms | Image resolution, model complexity, GPU generation |
| Acceptance logic evaluation | < 2ms | Number of configured criteria |
| PLC signal output | < 1ms | Protocol latency |
| Total end-to-end | 15–60ms typical | Configuration-dependent |
For a line running 600 parts per minute — 100ms per part — a 15–60ms inspection cycle leaves adequate margin for the part to remain within the rejection mechanism’s reach when an NG signal is issued. For higher-speed applications, the design must account for the distance between the inspection station and the rejection point.
What “Inline” Really Means for Production Operations
The word “inline” is sometimes used loosely to mean “on the factory floor.” In a rigorous sense, it means the inspection happens in the production flow — parts are inspected at production speed, with no handling, no sampling, and no buffer accumulation. Every part gets inspected, every cycle, with results available before the part exits the station.
The alternative — offline inspection, where parts are removed from the line, inspected in a separate station, and returned — is fundamentally a sampling approach. Statistical sampling has its place, but it cannot catch 100% of defects. For applications where a single escape has severe consequences (EV battery cells, automotive safety components, medical devices), 100% inline inspection is not an operational luxury — it is the quality architecture that makes the product’s safety promise credible.
→ See how UnitX FleX delivers the complete inline inspection pipeline — imaging, AI, and integration — as a single deployable system: UnitX FleX platform overview.
→ Considering inline inspection for your production line? Talk to UnitX experts — we’ll assess your line speed, part geometry, and defect types to recommend the right configuration.
Frequently Asked Questions
What happens if the inspection system misses a trigger?
Modern inline inspection systems include missed-trigger detection logic. If the expected part arrival signal is not received within a defined window, the system logs a “missed inspection” event and may trigger an alarm or a hold signal to the line PLC. Best practice is to configure the downstream rejection system to default to “reject” for parts with no inspection record, rather than defaulting to “accept.”
Can inline AI inspection handle multiple part variants on the same line?
Yes, with a model management architecture that supports rapid model switching. CorteX’s Central Management System maintains a library of trained models for each SKU or product variant. When the line switches variants — triggered by a barcode scan, a PLC signal, or a manual selection — the active inference model switches automatically. Switchover time is typically under 5 seconds, preserving inspection continuity during changeovers.
How does the system handle environmental factors like vibration or temperature changes?
Vibration can cause image blur in stop-capture configurations; fly capture with strobed illumination is less sensitive because the effective exposure time (set by the strobe pulse width) can be as short as 50–100 microseconds — short enough to freeze motion from typical line vibration. For temperature sensitivity, OptiX’s LED illumination system includes thermal monitoring and intensity compensation, maintaining consistent brightness as the system warms up over a production shift. The AI model itself is not affected by ambient temperature.