Zero-defect manufacturing is the only quality standard that Tier 1 automotive OEMs, battery gigafactory operators, and semiconductor assembly customers will accept from their suppliers without imposing 100% outgoing inspection at the receiving dock. Every defective part that escapes to the customer carries a cost that dwarfs the cost of the part itself: warranty repair, recall logistics, customer relationship damage, and — in safety-critical applications — liability that cannot be bounded by any quality system’s financial reserves.
The gap between a capable quality process and a zero-defect quality process is not a gap in inspection intent. Every manufacturer intends to ship zero defects. The gap is in inspection architecture: whether the inspection system can physically catch every defect type on every part at production line speed, or whether it operates on a statistical sampling model that guarantees a residual escape rate by design. This article explains the specific technical architecture of an inline AI inspection system that closes that gap — not as an aspiration, but as an engineered system with measurable performance targets.
Key Takeaways
- Zero-defect manufacturing requires 100% inline inspection at line speed — sampling-based inspection, regardless of sample size, has a non-zero escape rate by mathematical design.
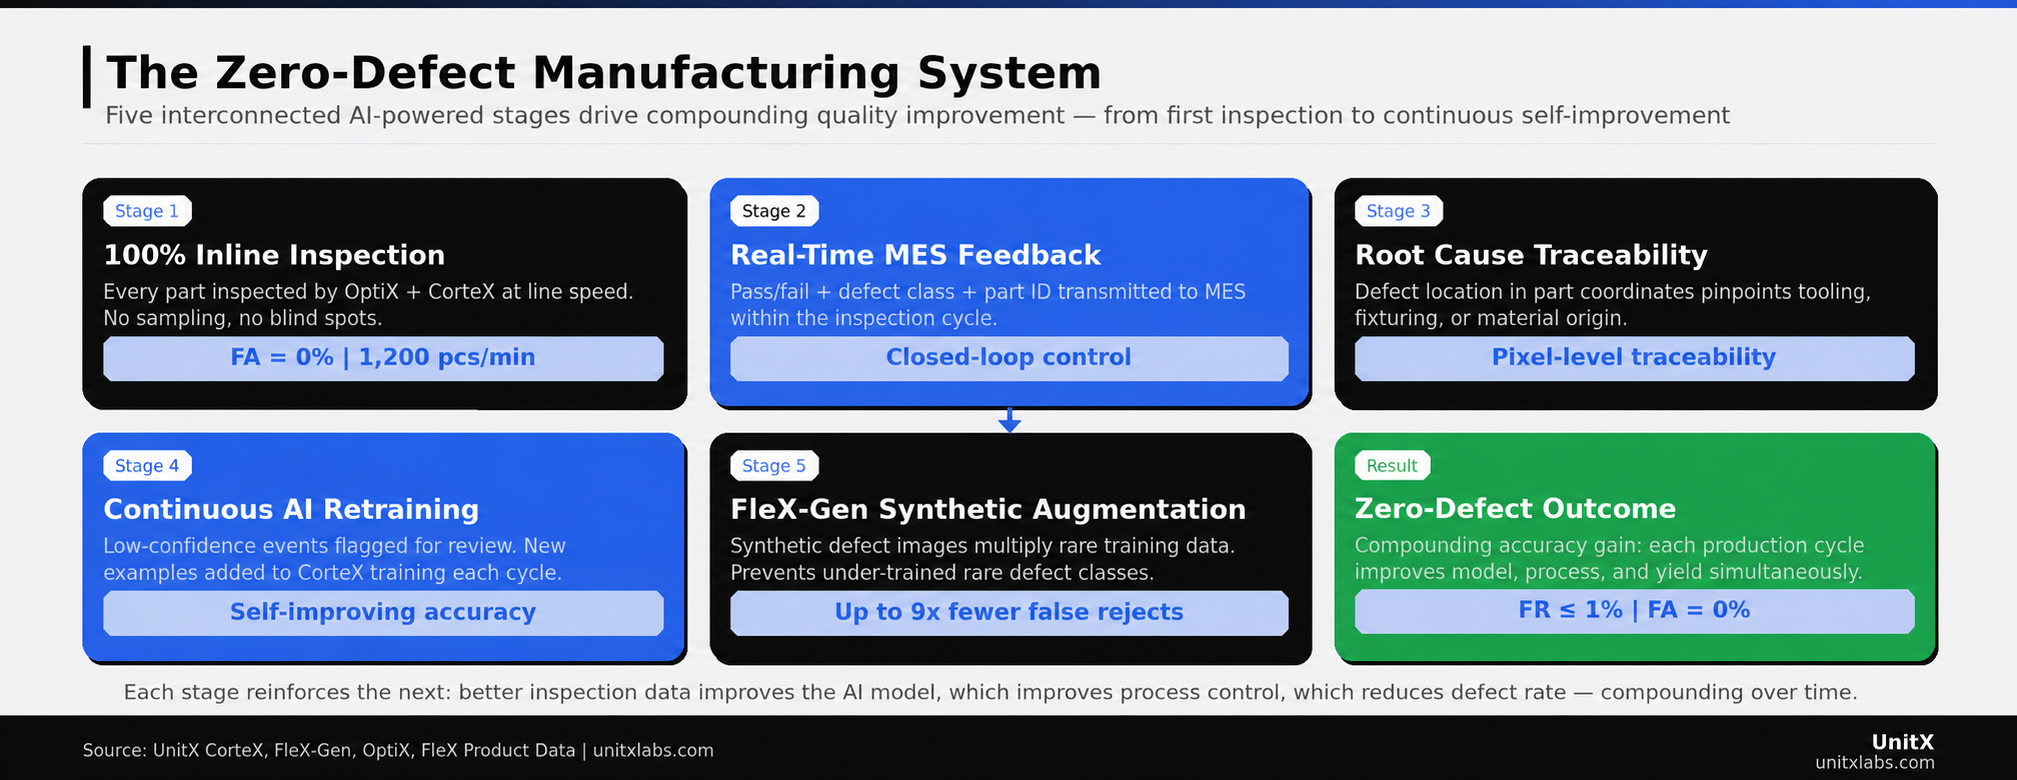
- The five-stage closed-loop quality flywheel — 100% inline inspection, real-time MES feedback, root cause analysis, continuous AI retraining, and synthetic data augmentation — creates compounding accuracy improvement rather than static performance.
- False Acceptance Rate (FA) = 0% is an achievable engineering target, not a marketing claim, when the inspection system combines software-defined multi-angle imaging with deep learning segmentation and per-part traceability.
- False Rejection Rate (FR) ≤ 1% is the economic constraint that makes zero-defect manufacturing commercially viable — over-inspection without precision costs more in scrap than escapes cost in warranty.
Why Zero Defects Requires 100% Inline Inspection
The Statistics of Sampling
Statistical process control (SPC) and sampling-based inspection share a fundamental mathematical property: when defect rates are low, sampling cannot provide high confidence that any individual part is defect-free. At a 100 ppm defect rate — 1 defect per 10,000 parts — a 10% sample inspection has a probability of detecting any specific defective part of approximately 10%. The defect either happens to be in the sample or it does not. SPC can tell you that the process is drifting toward higher defect rates; it cannot tell you that any particular batch is free of defects.
Automotive OEMs have moved to zero-tolerance incoming inspection precisely because 100 ppm at the supplier translates to thousands of defective units annually at the production volumes of modern vehicle programs. The only inspection methodology that provides a mathematical guarantee against escape is 100% inspection — every part, every time, with detection performance that meets the FA = 0% specification. (NIST/SEMATECH Engineering Statistics Handbook — What Is Acceptance Sampling?)
The Speed Constraint That Eliminates Manual 100% Inspection
Manual inspection can achieve 100% coverage — every part is reviewed by a human inspector — but it cannot achieve the inspection speed required to keep pace with automated production lines. A human inspector examining a machined automotive component at a thorough visual inspection pace can process 200–400 parts per hour under non-fatigue conditions. A modern machining cell produces the same components at 600–1,200 parts per hour. 100% manual inspection at line speed requires 3–6 inspectors per station, with accuracy degrading as inspection pace increases to match throughput.
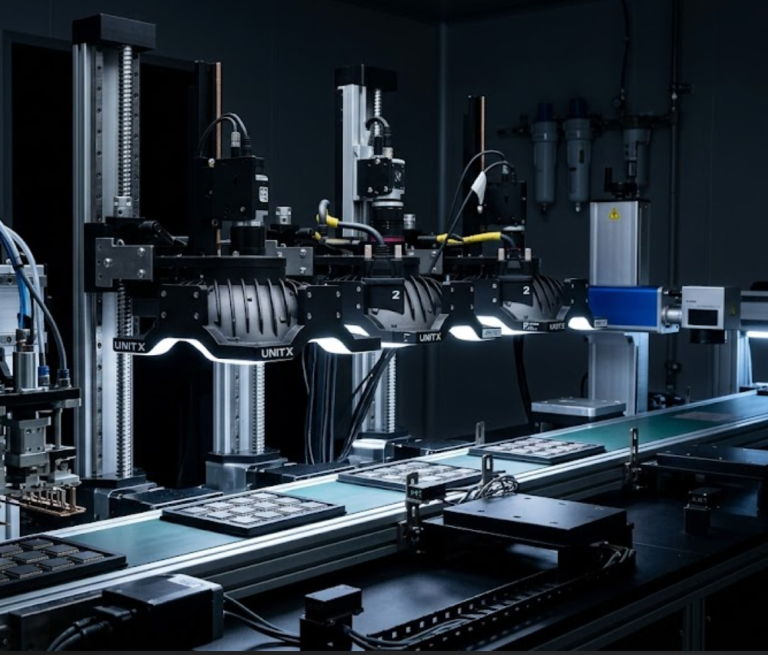
Inline AI inspection eliminates this constraint. CorteX inference throughput reaches 1,200 pieces per minute — 72,000 per hour — operating at the same accuracy on the ten-thousandth part as on the first. The inspection system does not fatigue, does not have attention lapses, and does not reduce thoroughness when production rate increases. This is the fundamental economic case for inline AI inspection at zero-defect quality targets: it is the only inspection approach that can simultaneously satisfy the 100% coverage requirement and the production throughput requirement without proportional labor cost scaling.
The Five-Stage Zero-Defect Manufacturing Flywheel
Stage 1 — 100% Inline Inspection at Line Speed
The foundation of zero-defect manufacturing is a physical inspection system capable of inspecting every part at production line speed. For reflective, complex, or high-mix surfaces — the conditions where inspection is most challenging and most consequential — this requires software-defined imaging rather than fixed-angle illumination.
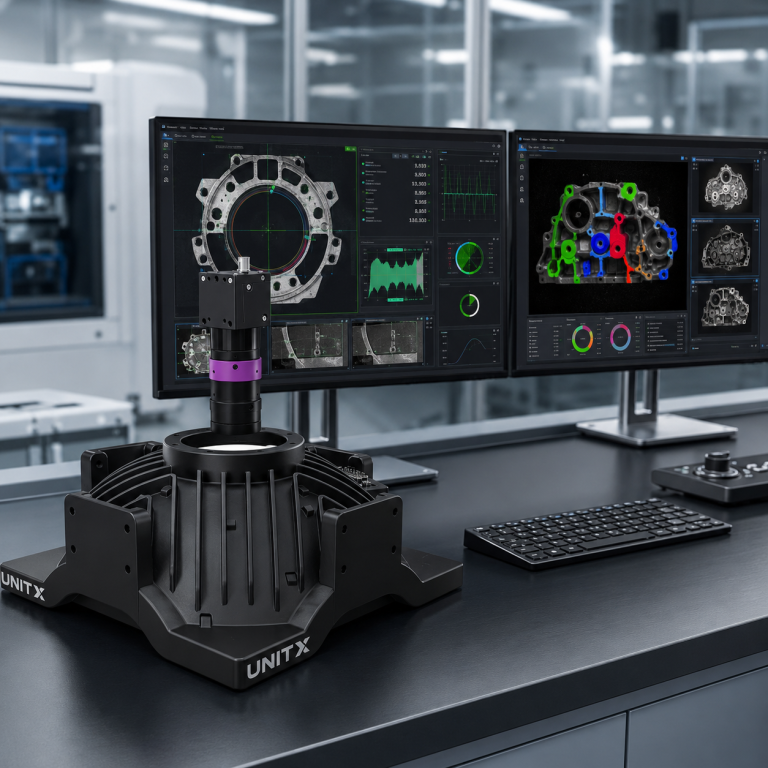
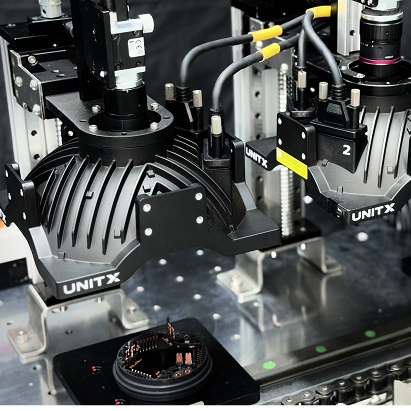
OptiX achieves 100% inline coverage at 1 m/s fly capture speed, with 50 MP resolution and 32 independent illumination channels providing the image quality needed for CorteX’s deep learning segmentation to operate at FA = 0% accuracy. The maximum throughput of 1,200 pieces per minute accommodates the production rates of high-volume manufacturing lines in automotive, battery, and semiconductor applications. The imaging system does not create a bottleneck: the inspection cycle time is embedded within the part’s transit time past the inspection station, and the pass/fail decision is available before the part reaches the next process step.
100% coverage is a necessary but not sufficient condition for zero-defect manufacturing. A 100% inspection system that misses 5% of defects is worse than a 10% sample inspection system with 99% per-part detection accuracy, because the”100% inspected” label prevents downstream precaution. The imaging quality and inference accuracy of the inspection system must justify the coverage claim — which is why the combination of OptiX multi-angle imaging and CorteX deep learning segmentation, rather than either alone, is the unit of inspection architecture. (OptiX imaging system specifications)
Stage 2 — Real-Time MES Feedback for Closed-Loop Control
100% inline inspection that generates pass/fail without connecting that data to process control is a quality gate, not a quality system. A quality gate stops defects from shipping. A quality system prevents defects from being produced. The difference between these two outcomes is Stage 2 of the flywheel: real-time integration with the Manufacturing Execution System (MES).
CorteX transmits the inspection result — pass/fail, defect class, defect location in part coordinates, and part serial number — to the plant MES within the inspection cycle time. This per-part data record enables the process engineering team to observe defect rate trends in real time rather than learning about them from quality review meetings that lag production by hours or days. When the defect rate for a specific class increases by 0.1% over a four-hour window, the process engineer sees it immediately and can investigate the cause before the defect rate reaches 1%, 2%, or the level at which a quality hold becomes necessary.
This real-time process feedback is documented as the highest-impact element of the zero-defect manufacturing architecture by multiple industry research bodies. McKinsey’s Industry 4.0 research identified that manufacturers who integrate 100% inline inspection data with real-time process control achieve 50–90% reductions in scrap rates within 18 months of deployment, compared to manufacturers who use the same inspection system as a pass/fail gate without the process integration layer. (McKinsey — Automation, Robotics, and the Factory of the Future)
Stage 3 — Root Cause Analysis from Defect Traceability Data
Per-part traceability data — the defect location in part coordinates correlated with the part serial number, production timestamp, machine ID, and tool ID — creates the dataset needed for systematic root cause analysis of defect origin. Without per-part traceability, a quality engineer investigating a defect cluster must rely on indirect evidence: machine logs, operator shift records, incoming material certificates. With per-part traceability from CorteX, the investigation begins with direct evidence: the exact spatial distribution of defects on the part surface, the exact time at which the defect rate changed, and the exact production cell from which defective parts originated.
The defect location data is particularly powerful. A scratch defect that appears consistently at the same location on the part surface — the same coordinates in the part’s reference frame — indicates a tooling or fixturing problem at a specific point in the machining process. The same scratch appearing at random locations across the part surface indicates a handling or contamination problem in a transit or storage step. These two root causes require completely different corrective actions, and only spatial traceability data can distinguish between them based on inspection data alone.
This level of root cause capability is what transforms an AI inspection system from a quality gate into a process intelligence platform. The inspection data is the highest-fidelity sensor in the quality system — it sees every part surface at pixel resolution — and its traceability to production metadata enables systematic process improvement that accumulates into a compounding yield advantage over time. The UnitX case study library documents specific examples of process root cause identification enabled by CorteX traceability data.
Stage 4 — Continuous AI Retraining on New Production Data
A static deep learning model — trained once and deployed without updates — will degrade in accuracy over time as the production environment evolves. Tool wear changes the surface finish of machined parts. New material batches introduce subtle surface property variation. New product variants introduce new surface geometries. Each of these changes shifts the statistical distribution of the inspection images away from the training distribution, and model accuracy decays proportionally to the magnitude of the shift.
The zero-defect manufacturing architecture requires continuous model improvement as a designed system property, not as a periodic maintenance event. When CorteX detects a defect instance with confidence below a defined threshold — meaning it has identified something anomalous but is not confident in its classification — that instance is automatically flagged for human review. If the review confirms the defect, the instance is added to the training dataset and used in the next CorteX retraining cycle.
This feedback mechanism means that production experience improves the model’s accuracy over time. Novel defect appearances encountered in month 6 of production are included in the training dataset for month 9. The model’s performance on rare defect types improves with each production cycle rather than degrading with each deviation from the original training conditions. This self-improvement property is what distinguishes AI inspection from the static accuracy ceiling of rule-based machine vision — and it is what makes zero-defect manufacturing a compounding advantage rather than a one-time deployment achievement.
Stage 5 — FleX-Gen Synthetic Data Augmentation for Rare Defects
The continuous retraining loop in Stage 4 is limited by the rate at which real defect examples are produced by the manufacturing process. A defect type that appears once per 50,000 parts generates one new training example every 50,000 cycles — at a production rate of 1,200 parts per minute, that is one new example every 41 minutes of production. A rare defect class that requires 50 examples to train effectively would take 34 hours of production to accumulate sufficient data from real production alone.
FleX-Gen resolves this limitation by generating synthetic defect images that are physically consistent with OptiX imaging characteristics. For any real defect example, FleX-Gen can generate dozens of synthetic variations — different defect sizes, different locations within the part area, and different surface orientations relative to the illumination geometry — that expand the effective training dataset by a factor of 10 or more from a single real example. This augmentation has been documented to reduce false rejection rates by up to 9x in production deployments by preventing the model from overfitting to the limited appearance variation of small real-example defect datasets. (FleX-Gen generative AI platform)
The practical consequence for zero-defect manufacturing is that the accuracy floor for rare defect types is maintained even when production defect rates are very low. The system does not wait for a cluster of defects to appear before the model becomes competent to detect them. FleX-Gen ensures that model coverage of rare defect types is maintained at the same confidence level as high-frequency defect types from the first day of production.
 The zero-defect manufacturing flywheel is self-reinforcing: each stage generates data and performance improvement that strengthens the next. The result is a quality system that improves with production experience rather than degrading over time.
The Performance Metrics That Define Zero-Defect Success
FA = 0%: What It Means and What It Requires
A false acceptance rate (FA) target of 0% means that no defective part that passes through the inspection station is classified as acceptable. This is the foundational requirement of zero-defect manufacturing — without it, the “100% inspected” label creates false confidence that is more dangerous than acknowledged uncertainty.
Achieving FA = 0% requires that the inspection system’s detection threshold for every defect class be set conservatively enough that no defect crosses it. In practice, this means that the model’s confidence score for a defective part is reliably below the acceptance threshold — not merely lower than average. This requires training data that covers the full range of defect appearance variation for each class, including edge cases that a conservative training dataset might exclude. The combination of real production examples, FleX-Gen-augmented synthetic variations, and continuous retraining from production data is the architecture that makes this requirement achievable rather than aspirational.
FR ≤ 1%: The Economic Constraint on Precision
A zero-false-acceptance system that achieves FA = 0% by classifying every part as defective technically meets the FA specification but produces 0% yield. The false rejection rate (FR) constraint — ≤ 1% in standard UnitX deployments, ≤ 5% in applications with higher acceptable scrap tolerance — is what makes zero-defect manufacturing economically viable rather than merely mathematically possible.
FleX-Gen augmentation is the primary lever for reducing FR without compromising FA. By ensuring that the model is trained on a wide distribution of good-part surface appearance variation — including edge cases that look superficially similar to defects — the model learns the decision boundary between acceptable and defective parts more precisely. This precision allows the acceptance threshold to be set at a level that achieves FA = 0% without sweeping an unacceptably large fraction of good parts into the reject bin.
The documented FR reduction of up to 9x from FleX-Gen augmentation is the mechanism that closes the gap between theoretical zero-defect inspection performance and the production economics of a commercially viable quality system. Achieving both FA = 0% and FR ≤ 1% simultaneously is the benchmark for world-class AI inspection performance. (IEEE — Deep-Learning Enabled Automatic Optical Inspection for Module-Level Defects)
Implementation Roadmap
Phase 1: Sample Inspection and Baseline Validation (Days 1–3)
The deployment begins with a structured sample inspection run against actual production parts: a set of known-good parts and a set of known-defective parts covering the target defect classes at the specification threshold. The sample run validates that the OptiX imaging configuration captures the target defects with sufficient contrast for CorteX to classify them, and it establishes the initial training dataset for the CorteX model.
At the end of Phase 1, the system produces a baseline performance report documenting FA and FR on the sample set against the agreed specification. This report is the engineering commitment that validates the system design before production installation. If the sample run performance does not meet specification, Phase 1 is extended to capture additional training data or to optimize the OptiX illumination recipe — before the production line is committed to the inspection configuration.
Phase 2: Production Installation and MES Integration (Days 4–5)
Physical installation of OptiX into the production line is typically a one-day mechanical operation. The imaging system is designed for inline installation with standard conveyor integration, and the enclosure dimensions are configured for the specific line geometry during the pre-installation engineering review. MES integration — configuring the data protocol, part identifier format, and result transmission parameters — runs in parallel with mechanical installation.
Site Acceptance Testing (SAT) completes on Day 5 of a standard UnitX deployment. SAT validates that the system meets the agreed FA and FR specification on live production parts, that MES data transmission is functioning correctly, and that the operator interface is configured for the production team’s workflow. The target of Days to SAT: 5 days compresses the integration timeline by a factor of 4–10 relative to conventional machine vision deployments, which typically require 3–8 weeks to reach production-ready SAT status.
Phase 3: Continuous Improvement Loop (Months 1+)
After SAT, the system enters the continuous improvement phase. CorteX flags low-confidence inspection events for review, new confirmed defect examples are added to the training dataset, and the model is retrained on a defined schedule — typically weekly or monthly, depending on the defect event rate. FleX-Gen augmentation is applied to each new defect category that enters the dataset to ensure sufficient training coverage from the first retraining cycle.
Process engineers receive weekly inspection data summaries from the MES integration, documenting defect rate trends by class, location, and production cell. These summaries drive systematic process improvement that reduces the underlying defect rate over time. The combination of inspection accuracy improvement from continuous retraining and process defect rate reduction from data-driven process control is the compounding quality improvement dynamic that makes zero-defect manufacturing a durable competitive advantage rather than a point-in-time achievement. Learn about the full deployment approach on the UnitX solutions page.
| Phase | Duration | Deliverable |
| Phase 1 — Sample Inspection | Days 1–3 | Baseline FA/FR report; CorteX initial model; OptiX recipe validated |
| Phase 2 — Production SAT | Days 4–5 | System installed; MES integrated; SAT completed; line running |
| Phase 3 — Continuous Improvement | Month 1+ | Weekly model retraining; process defect rate trending; compounding accuracy gain |
Common Questions
Is FA = 0% mathematically achievable, or is it always an asymptote?
FA = 0% is an engineering specification, not a mathematical limit. It means that zero defective parts pass inspection within the validated defect categories at the agreed specification threshold. There is a meaningful difference between “no defect in the validated category at threshold size passes” and “no defect of any type anywhere on the part passes regardless of specification.” The former is an achievable engineering target that CorteX is designed to meet. The latter is an unspecified claim that no inspection system can validate, because it requires knowing what has not been defined.
What happens if a new defect type appears in production that the model was not trained on?
A CorteX model trained on a specific set of defect classes will classify a novel defect type as anomalous — it falls outside the distribution of both good-part and known-defect training data — and the confidence score for both the “pass” and “fail” classes will be low. This triggers the low-confidence flagging mechanism, routing the part for human review. The reviewed part is then labeled and added to the training dataset as a new defect class, and the model is retrained to include the new category. This process typically takes one retraining cycle — one week in a standard deployment schedule — from first observation to production-level model coverage of the new defect type.
How does the system handle normal surface variation that looks similar to defects?
FleX-Gen augmentation of the good-part training dataset is the primary mechanism for handling surface variation. By generating synthetic variations of good-part appearances — including surface finish variation from tool wear, coating thickness variation, and material batch variation — the model learns the full distribution of acceptable surface appearances rather than overfitting to the narrow sample of good parts in the initial training set. This wide good-part distribution is what enables the model to set the FA = 0% / FR ≤ 1% decision boundary precisely rather than conservatively.
What is the practical minimum production volume for inline AI inspection to be cost-effective?
The cost-effectiveness threshold depends on the cost per defective escape — warranty, recall, liability — rather than on production volume alone. For safety-critical components where a single escape has liability implications measured in hundreds of thousands of dollars, inline AI inspection is cost-effective at production volumes as low as a few thousand parts per year. For commodity components where escape cost is dominated by rework and warranty, the production volume threshold is higher. A practical evaluation of cost-effectiveness for a specific application requires comparing the expected annual cost of the current inspection approach — including escape rate × escape cost and false rejection rate × part cost — against the deployment and operating cost of the AI inspection system. UnitX provides this analysis as part of the pre-deployment engineering review.