A False Rejection Rate (FR) that creeps above 1% is not just a yield problem, it is a credibility problem. Every good part your AI inspection system scraps becomes an argument your production manager will use against the technology at the next budget review. The uncomfortable reality is that high FR is almost always a data and configuration issue, not a fundamental limitation of AI visual inspection. This guide walks through seven engineering-proven strategies to bring FR below 1% while maintaining a False Acceptance Rate (FA) of 0%.
Key Takeaways
- FR and FA are not symmetrically controlled: optimizing for FA=0% does not automatically produce low FR, and the strategies for each are different.
- Image variance from inconsistent lighting is the most common, and most fixable, root cause of elevated FR.
- Deep learning segmentation with dimensional thresholding eliminates the majority of “technically a defect but not a real reject” false rejections.
- Synthetic defect augmentation via generative AI can reduce FR by up to 9× for rare defect classes.
- FR is not a set-and-forget metric — model drift monitoring with golden samples is required to sustain performance over time.
Understanding the FR/FA Trade-off Before You Start
False Rejection Rate (FR) and False Acceptance Rate (FA) are connected through the model’s confidence threshold — raising the threshold reduces FA (fewer defects escape) but increases FR (more good parts are rejected). The engineering challenge is to find the per-class threshold that holds FA at exactly 0% while minimizing FR. The seven strategies below address FR from different angles: data quality, model architecture, threshold tuning, and ongoing operations. A team that executes all seven can typically achieve FR ≤ 0.5% on precision-manufactured parts.
According to NIST’s AI in Manufacturing Workshop Summary, an FR above 2% is the most commonly cited reason manufacturers abandon AI inspection pilots and revert to manual inspection — making FR management the most critical operational variable in a successful AI inspection deployment.
Strategy 1: Standardize Your Lighting Before Collecting Any Data
Why Lighting Variance Drives False Rejections
When your AI model sees a surface highlight in position A on the morning shift and position B on the afternoon shift, it learns to flag the discrepancy as a potential defect. It is not wrong — there is a real image difference — but the difference is caused by lighting, not by a manufacturing defect. This is the most common source of FR on metallic, ceramic, and reflective polymer surfaces.
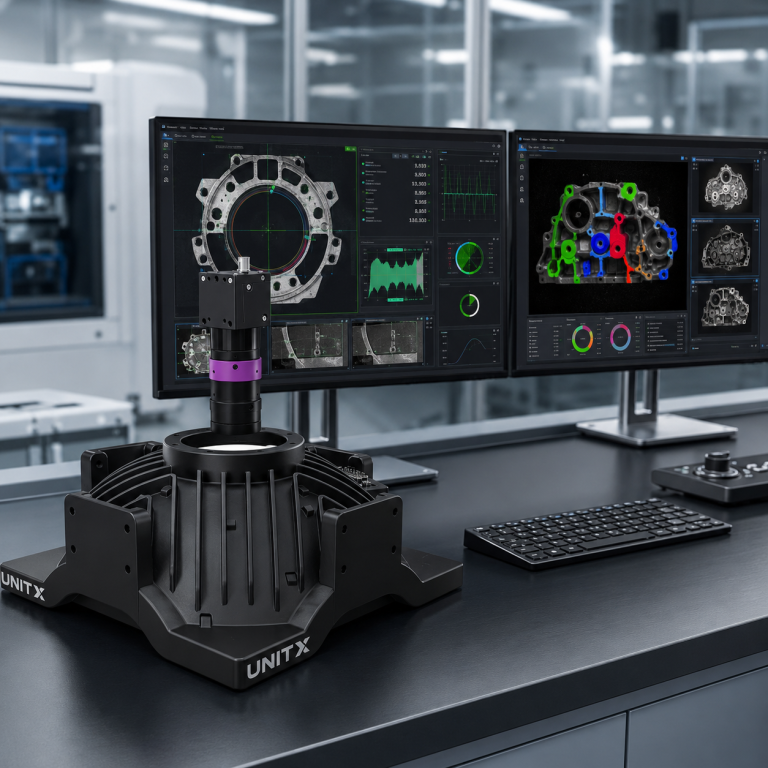
Software-defined imaging systems with independently controlled illumination channels solve this at the source. When every image is captured under identical lighting conditions — same channels, same intensity, same angle — the model’s input distribution remains consistent across shifts, operators, and weeks. Teams that standardize lighting before data collection typically report a 30–40% FR reduction on metallic surfaces without any model change. OptiX’s 32-channel independent lighting control provides the reproducibility required to eliminate illumination variance as a variable.
Practical Steps
Audit your current lighting by photographing the same known-good part in the exact same fixture or position at four different times of day, then overlay the images. If surface highlight positions shift by more than a few pixels, your lighting is not stable enough for reliable AI training. Document the approved lighting configuration in your data collection protocol and lock it before capturing a single training image.
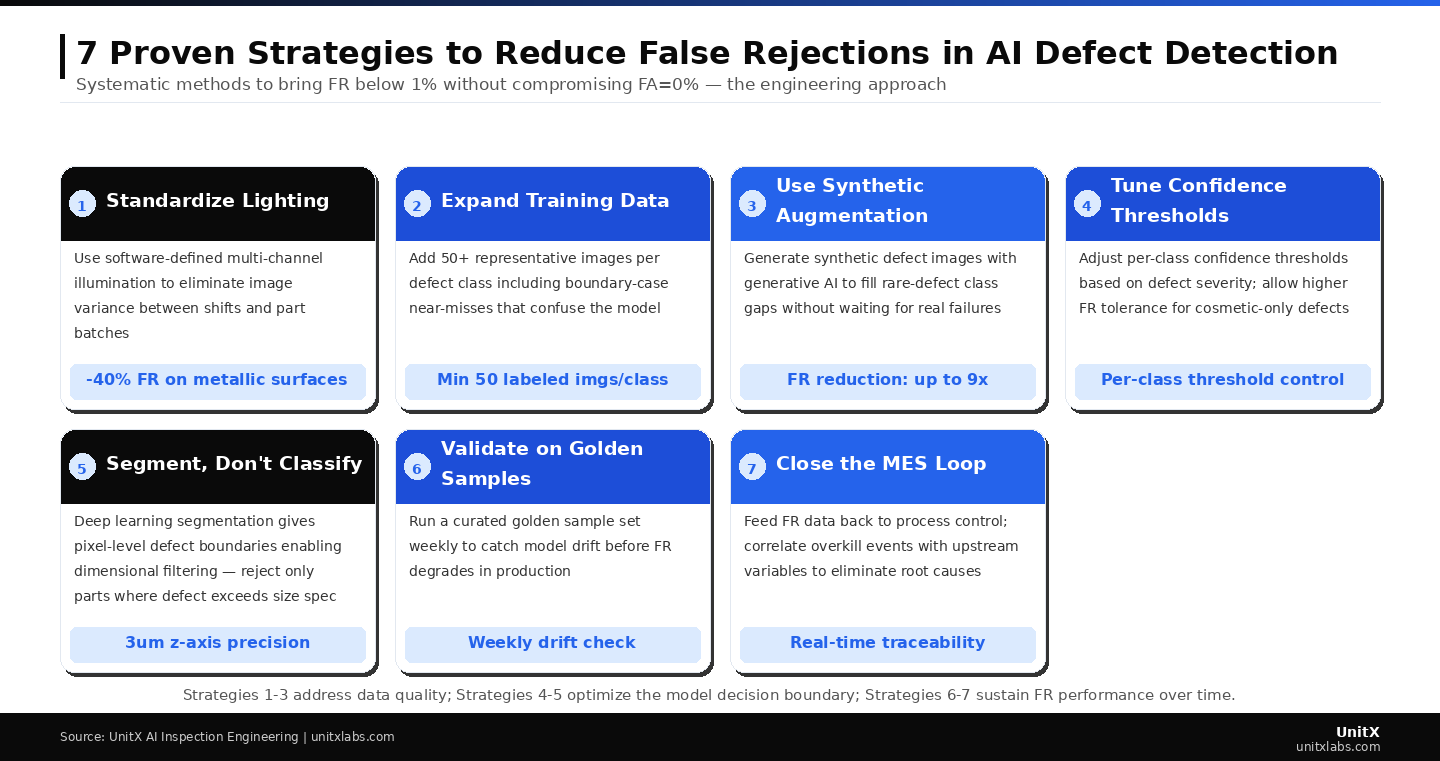
Strategies 1–3 address data quality at the root; Strategies 4–5 optimize where the model draws its decision boundary; Strategies 6–7 sustain FR performance as production evolves over time.
Strategy 2: Expand Your Training Dataset with Boundary-Case Images
The Problem With Minimum Viable Datasets
A dataset of exactly 50 images per defect class gives you a model that works in the lab. It gives you a model that generalizes to production variation only if those 50 images represent the full surface of surface finish, geometry, and orientation variation your line produces—which they rarely do. The images that reduce FR most dramatically are not additional examples of obvious defects — but boundary cases: near-misses that a human inspector would pass, images with minor surface variation, and parts at the edges of your dimensional tolerance range.
Explicitly labeling and including these boundary cases teaches the model where the true accept/reject boundary lies, rather than allowing it to learn an overly conservative threshold that rejects anything deviating from the “perfect” training image. UnitX’s technical documentation recommends targeting 15–20% of your training set as boundary-case “hard negative” examples to train the model’s decision boundary accurately.
Strategy 3: Use Generative AI to Fill Rare Defect Class Gaps
The Rare Defect Catch-22
For common defects, such as scratches, chips, contamination, collecting 50+ examples is straightforward. For rare defects, such as stress cracks, subsurface inclusions, once-per-thousand-part failures, you may wait months to collect enough real examples for reliable training. In the meantime, the model, having seen few real examples, may either fail to detect them (FA > 0%) or overcompensate by flagging similar patterns (elevating FR on adjacent defect classes).
Generative AI models trained on even a small number of real rare-defect images can generate statistically plausible synthetic examples, expanding the dataset to a usable size in hours rather than months. The critical requirement is that synthetic images be validated against real examples before use — a quality gate that prevents synthetic artifacts from contaminating the training distribution. According to published research on synthetic data augmentation for industrial inspection, well-validated synthetic data can reduce FR on rare defect classes by 50–80% compared to training on real data alone.
Strategy 4: Tune Per-Class Confidence Thresholds Based on Defect Severity
Why a Single Global Threshold is Incorrect
Most initial AI inspection deployments use a single confidence threshold applied uniformly across all defect classes. This is convenient but incorrect. A structural crack in a load-bearing automotive component has zero tolerance —an FA of 0% is required regardless of FR cost . A cosmetic surface blemish on an interior trim part may have a tolerance of 3mm, meaning the inspection standard allows borderline parts to pass. Applying the same conservative threshold to both classes over-rejects acceptable cosmetic parts while providing no additional protection for critical defects.
Per-class threshold configuration allows more conservative threshold for safety-critical defects and a more permissive threshold for cosmetic defects, reducing overall FR without increasing FA for critical classes. This configuration should be documented in the model specification and reviewed during each SAT cycle. ISO 9001:2015 requires that inspection criteria reflect actual quality specifications, providing the basis for per-class threshold differentiation.
Strategy 5: Replace Classification with Deep Learning Segmentation
Dimensional Filtering Eliminates Specification-Compliant Rejects
A classification model answers: “Does a defect exist?” A deep learning segmentation model answers: “Where is the defect, and what are its pixel-level dimensions?” For production quality specifications defined by physical thresholds, such as “scratch length ≥ 0.5mm” or”pit diameter ≥ 0.3mm” — only a segmentation model can enforce the actual specification. A classification model must be calibrated conservatively, inevitably rejecting parts with sub-threshold defects that the specification permits.
Segmentation-based inspection with dimensional filtering enforces the quality specification: if the detected defect boundary measures below the specification threshold, the part passes, as defined by the quality plan. This architectural shift can eliminate 20–40% of FR on parts with tight tolerances. CorteX’s deep learning segmentation provides pixel-level defect boundaries and adjustable thresholds, enabling enforcement of dimensional thresholds well below the millimeter scale.
Strategy 6: Validate Weekly with Golden Samples to Catch Model Drift Early
FR Does Not Stay Fixed After Go-Live
A model validated during SAT will gradually drift as surface finishes evolve, tooling wears, and material batches change. Drift is not a failure — it is physics. The question is whether you catch it before it affects production yield. Golden sample testing — running a curated set of known-good and known-defective parts through the system on a weekly or biweekly schedule — provides an early warning before FR impacts production yield.
The golden sample set should represent full production variability: multiple operators’ parts, shift lighting conditions, and surface finish batches. Results should be logged against the SAT baseline and reviewed by a quality engineer. A statistically significant increase in FR (e.g., more than 0.5% above baseline) should trigger a retraining review, not an immediate shutdown. NIST’s AI manufacturing guidelines recommend periodic validation as a best practice for maintaining AI inspection performance.
Strategy 7: Close the MES Loop: Feed FR Data Back to Process Control
Treating FR as a Process Signal, Not Just an Inspection Metric
If your AI inspection system is rejecting 0.8% of parts, the key question is: which parts, from which shift, and under which process conditions? A closed-loop MES integration answers this automatically. Each rejected part is linked to machine ID, operator, shift, raw material lot, and process parameters at the time of production. When FR spikes, engineers can identify the root cause within minutes rather than conducting a multi-day investigation.
This transforms FR reduction from reactive troubleshooting into proactive process improvement. UnitX’s AI-powered inspection solutions include native MES integration for real-time traceability. According to McKinsey’s factory of the future research, manufacturers that close the quality data loop achieve sustained FR improvement of 15–25% per year, compounding as the process control feedback accumulates over time.
FR Reduction Benchmark: What to Expect from Each Strategy
| Strategy | Typical FR Reduction | Implementation Effort |
| 1. Standardize lighting | 30–40% on reflective surfaces | Low (protocol + hardware config) |
| 2. Add boundary-case images | 15–25% general improvement | Medium (data collection + labeling) |
| 3. Synthetic augmentation | 50–80% on rare defect classes | Medium (generative AI setup) |
| 4. Per-class threshold tuning | 10–20% on cosmetic classes | Low (configuration change) |
| 5. Segmentation + dimensional filter | 20–40% on dimensional specs | High (model architecture change) |
| 6. Weekly golden sample monitoring | Prevents drift-driven FR increase | Low (protocol + schedule) |
| 7. MES loop closure | 15–25%/year compounding | High (IT integration) |
Frequently Asked Questions
Is an FR of exactly 0% a realistic target?
FR = 0% is mathematically possible on a homogeneous part with a well-defined defect taxonomy, but it is not the engineering target for most production applications. The economically rational target is FR ≤ 1%, where overkill scrap cost is lower than the cost of maintaining more conservative thresholds. For high-value aerospace or medical components, stricter targets may be justified, but they require significantly more data and more frequent model validation cycles.
Can we reduce FR without retraining the model?
Threshold tuning (Strategy 4) can reduce FR without retraining — it is a configuration change, not a model change. For all other strategies, some retraining is required. However, retraining with a clean, expanded dataset is fast on modern hardware and typically completes in hours, not days. The cost of retraining is far lower than the cost of ongoing yield loss from elevated FR.
How do we know if our FR problem is a data issue or a model architecture issue?
Run a diagnostic: take your highest-FR defect class and review 50 consecutive false rejections manually. If the rejected parts share a common surface characteristic (e.g., consistent highlight position or minor surface finish variation), the root cause is likely data or lighting. If the rejected parts appear random with no common pattern, the root cause is more likely model architecture or threshold calibration. Data and lighting diagnosis are far more common and much easier to fix. UnitX’s engineering blog covers FR diagnostic methodology in detail.
Does increasing image resolution always reduce FR?
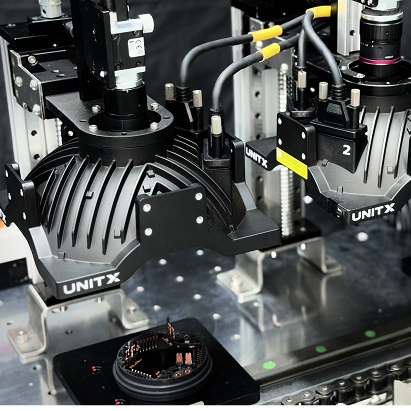
Higher resolution improves the model’s ability to resolve fine defect details, which can reduce FR for small-defect classes. However, increasing resolution also raises cycle time (CT) and compute requirements. The correct resolution is the minimum required to reliably capture the smallest defect defined in your specification — not the maximum your camera supports. Oversized images increase CT without delivering proportional FR improvement. OptiX’s multi-angle imaging system supports up to 50 megapixels per image, providing the flexibility to match resolution to inspection requirements.