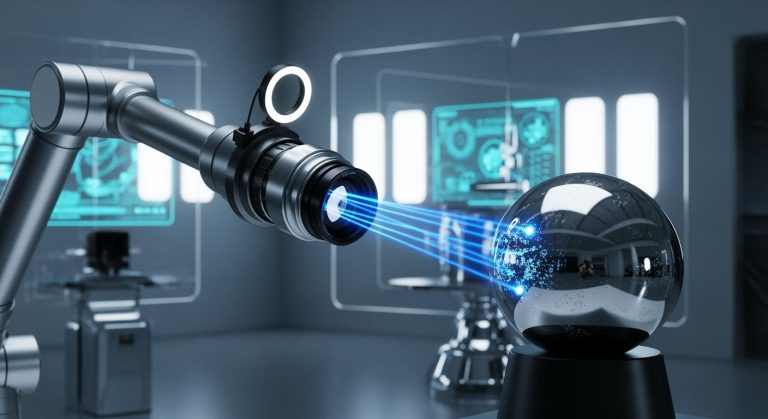
A statistical distribution machine vision system in 2025 uses advanced model techniques for computer vision tasks. Engineers rely on model-driven learning to improve system performance. The machine vision system applies computer vision to measure pixel intensity distributions and estimate object sizes. A model tracks data drift to ensure system reliability. Computer vision experts use learning models to detect anomalies from data drift. Each system uses data analysis and learning to maintain accuracy. The model adapts to new patterns from data drift. Machine vision system learning supports robust computer vision in modern industry.
Key Takeaways
- Pixel intensity analysis uses histograms to detect noise and improve image quality quickly and reliably.
- Size distribution estimation measures object sizes accurately to find defects and ensure high inspection standards.
- Data drift detection monitors changes in data over time to catch anomalies early and keep inspection accurate.
- Machine learning models help the system adapt to new patterns and defects, improving performance continuously.
- Combining these methods creates a strong, reliable system that supports quality control in many industries.
Pixel Intensity Analysis
Histogram Methods
A statistical distribution machine vision system in 2025 relies on pixel intensity analysis as a core function. The system uses histograms to represent the frequency of pixel values in an image. Engineers use this method for image processing because it provides a clear view of the data distribution within each image. The system collects pixel data during acquisition and then processes it using advanced model techniques. Each model examines the histogram to identify patterns and noise types.
- Histogram-based similarity metrics help the system detect predominant noise, such as Poisson noise, in medical images.
- Comparative studies show that histogram analysis performs robustly alongside other metrics, including L2 norm, SSIM, and CNN-based classification.
- The system accurately estimates noise types, confirming the reliability of histogram methods in image processing tasks.
- Consistent results across different evaluation metrics highlight the robustness and accuracy of histogram methods in machine vision system applications.
The system uses these findings to improve image processing and ensure reliable acquisition. Engineers trust histogram methods for their ability to handle various data distribution scenarios in computer vision.
Statistical Modeling
Statistical modeling plays a vital role in pixel intensity analysis for any machine vision system. The model treats each pixel as an independent variable, allowing the system to analyze the data distribution across the entire image. During acquisition, the system gathers pixel data and applies statistical models to interpret the results. This process supports accurate image processing and helps the system adapt to new data distribution patterns.
Machine learning models enhance the system’s ability to learn from pixel intensity data. The model updates itself based on new acquisition cycles, ensuring the system remains effective even as data distribution changes. Computer vision experts use these models to improve image processing system performance and maintain high accuracy.
The system integrates statistical modeling with histogram methods to create a comprehensive approach to pixel intensity analysis. This combination allows the statistical distribution machine vision system to deliver reliable results in various computer vision and image processing applications.
Size Distribution Estimation

Object Measurement
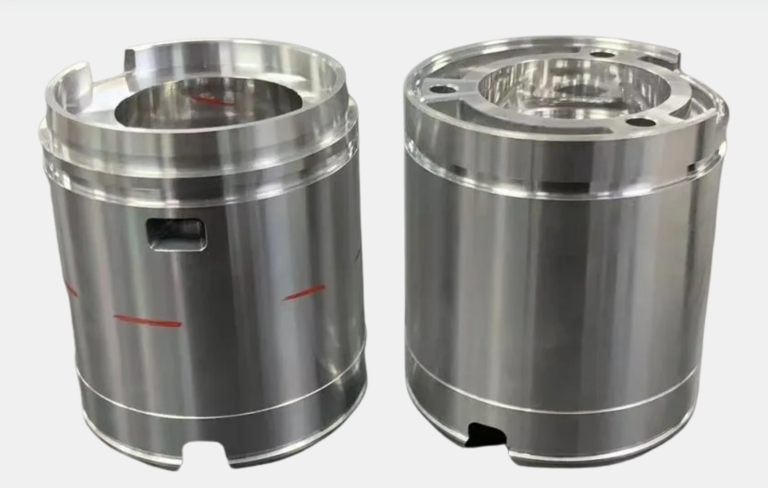
A statistical distribution machine vision system in 2025 uses advanced model techniques for object measurement. The system starts with image acquisition, capturing high-resolution images for analysis. Engineers use object detection to identify items in each image. The model then measures the size of each object by analyzing pixel data. This process supports accurate classification and meets strict inspection requirements.
The system applies machine learning models to improve object detection and measurement. These models learn from previous acquisition cycles. They adapt to new data distribution patterns and improve accuracy. The model compares measured sizes to expected values. This step helps the system detect defects and ensures each object meets inspection requirements.
Note: Accurate object measurement reduces the risk of defects passing through inspection. The system uses model-driven learning to maintain high standards in processing and analysis.
Error Handling
Error handling plays a key role in size distribution estimation. The machine vision system uses a dedicated error classification function to identify and manage errors during processing. The model tracks errors that occur during acquisition or object detection. It uses learning to adapt to new types of errors and defects.
Engineers rely on the model to separate true defects from processing artifacts. The system uses computer vision and machine learning models to analyze the data distribution of errors. This approach improves the reliability of inspection and supports robust processing. The model updates itself after each acquisition, learning from new errors and improving future performance.
The system ensures that all defects are detected and classified correctly. This process supports high-quality inspection and reduces the impact of errors on production. The model-driven approach allows the machine vision system to adapt to changing data distribution and inspection requirements.
Data Drift Detection
Anomaly Detection
A statistical distribution machine vision system in 2025 uses advanced model techniques for detecting data drift and identifying defects. The model tracks changes in data distribution during processing. When the system detects data drift, it triggers anomaly detection routines. These routines use machine learning models to compare current data with historical patterns. The model identifies unusual patterns that may signal defects or model drift.
Engineers rely on the system to catch subtle defects that standard inspection might miss. The model analyzes pixel data, object detection results, and processing outputs. If the model finds a shift in data drift, it flags the detection for review. This process helps prevent defects from passing through inspection. The system uses computer vision and machine learning models to improve detection accuracy.
Note: Detecting data drift early reduces the risk of model drift and ensures high-quality inspection results.
Real-Time Monitoring
Real-time monitoring plays a critical role in controlling data drift and model drift. The machine vision system continuously checks for changes in data distribution during processing. The model updates itself with each acquisition cycle. Monitoring data drift allows the system to adapt quickly to new patterns. The system uses object detection and computer vision to track defects and model drift in real time.
The model supports learning by updating detection thresholds based on recent data. Engineers use monitoring data drift to maintain consistent inspection quality. The system flags any detection of data drift or model drift for immediate action. This approach ensures that defects do not compromise production quality.
- The system uses real-time alerts for detecting data drift and model drift.
- Engineers review flagged detections to confirm defects.
- The model adapts to new data drift patterns, improving future detection.
The machine vision system in 2025 relies on robust model-driven learning to control data drift, model drift, and defects during processing and inspection. This approach supports industrial automation and quality control.
Statistical Distribution Machine Vision System Comparison
A machine vision system in 2025 uses three main statistical distribution methods. Each method supports different aspects of inspection and quality control. The table below compares these methods for quick reference:
| Method | Focus Area | Key Benefit | Typical Use Case |
|---|---|---|---|
| Pixel Intensity Analysis | Pixel value distribution | Fast noise identification | Medical image processing |
| Size Distribution Estimation | Object measurement | Accurate defect detection | Manufacturing inspection |
| Data Drift Detection | Data distribution changes | Early anomaly detection | Industrial automation |
Note: Each system method addresses unique challenges in detection and inspection. Engineers select the right approach based on production needs.
- Pixel intensity analysis helps the system identify noise patterns quickly. This method works best in environments where image quality impacts detection results.
- Size distribution estimation allows the system to measure objects and find defects. This approach supports inspection tasks that require precise measurements.
- Data drift detection gives the system the ability to monitor changes in data over time. The system can spot data drift and model drift before they affect detection accuracy.
Engineers rely on data drift detection to maintain consistent inspection quality. The system adapts to new data drift patterns and prevents model drift from causing missed defects. Each method strengthens the overall detection process. The combination of these methods ensures the system delivers reliable inspection results in dynamic industrial settings.
Machine vision systems in 2025 rely on pixel intensity analysis, size distribution estimation, and data drift detection to deliver accurate and reliable results.
- These methods help industries reduce downtime, improve quality, and increase productivity.
- Advanced AI models and synthetic data generation support rare defect detection and system adaptability.
The rapid growth of the global machine vision market signals a future where statistical distribution approaches drive innovation, efficiency, and broader adoption across industries.
FAQ
What is a statistical distribution machine vision system?
A statistical distribution machine vision system uses data analysis to inspect images. The system measures patterns, object sizes, and changes in data. Engineers use these systems to improve quality control and detect defects in manufacturing and automation.
How does pixel intensity analysis help in image processing?
Pixel intensity analysis examines the brightness of each pixel. The system uses histograms to find patterns and noise. This method helps engineers identify defects and improve image quality in real time.
Why is data drift detection important in machine vision?
Data drift detection finds changes in image data over time. The system tracks these changes to prevent errors. Early detection helps engineers maintain high inspection accuracy and avoid missed defects.
Can machine vision systems adapt to new types of defects?
Yes. Modern machine vision systems use learning models. These models update themselves with new data. The system adapts to new defect types and changing inspection needs.
What industries benefit most from statistical distribution machine vision systems?
Industries such as electronics, automotive, and pharmaceuticals use these systems. They rely on fast, accurate inspection to maintain product quality and reduce production errors.