Imagine a factory robot sorting objects on a conveyor belt. Sometimes, the system mislabels items or confidently makes mistakes. Model evaluation machine vision system means checking how well the system recognizes, detects, or segments images in real-world tasks. Choosing the right performance metrics for each computer vision task ensures the system works as expected. For example, accuracy, precision, and recall each tell a different story about system performance.
- Models often show a performance gap: they recognize objects but struggle with questions needing deeper knowledge.
- Some models have error rates below 50% for object recognition, but their confidence often exceeds their true accuracy.
- Larger models, like Qwen2-VL, improve accuracy from 29.0% to 50.6% as size increases.
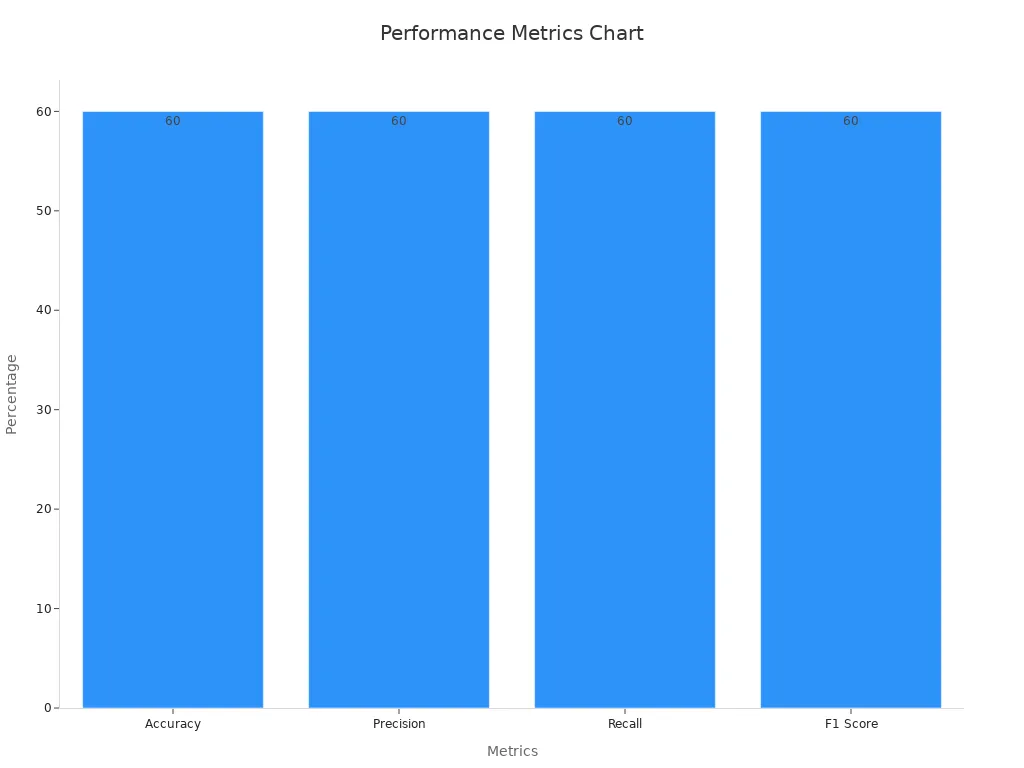
Model evaluation in a machine vision system never stops. Both offline testing and online monitoring help catch issues like bias or data drift. Machine vision systems need this constant feedback to stay reliable in changing environments.
Key Takeaways
- Model evaluation is essential to ensure machine vision systems recognize and process images accurately in real-world tasks.
- Different metrics like accuracy, precision, recall, and IoU measure various aspects of model performance and help identify strengths and weaknesses.
- Continuous evaluation, both offline and online, keeps systems reliable by detecting data drift, bias, and performance drops early.
- Choosing the right metrics aligned with business goals improves decision-making and system effectiveness.
- Using validation methods like cross-validation and monitoring tools helps prevent overfitting and maintains high accuracy as data changes.
Model Evaluation in Machine Vision Systems
Why Model Evaluation Matters
Model evaluation machine vision system plays a central role in computer vision. It checks how well a system performs tasks like recognition, detection, and segmentation. In real-time environments, a system must process data quickly and accurately. Model evaluation measures predictive ability, generalization, and quality. These factors help teams understand if a machine learning model can handle new data or only works on training examples.
A recent review of machine vision systems for pain recognition in infants highlights the importance of using clear metrics. The table below shows how experts assess model effectiveness:
| Aspect | Description |
|---|---|
| Population | Infants experiencing pain |
| Intervention/Exposure | Automatic facial expression ML algorithms for pain assessment |
| Control | Indicator-based pain assessment gold-standard (pain scales, scores) |
| Primary Outcome | Model accuracy measured by numeric scores (mean SE) and categorical pain degree (AUC ROC) |
| Secondary Outcomes | Generalisability, interpretability, computational efficiency and related costs |
| Key Statistical Metrics | Accuracy, AUC ROC, concordance stats |
| Current Gaps | Lack of meta-analyses comparing model performance, generalisability, interpretability |
This table shows that model evaluation in machine vision systems uses both accuracy and AUC ROC to measure recognition. It also points out the need for better comparisons and more focus on generalization.
Case studies show that regular performance evaluation improves recognition and processing in real-time systems. For example, one system reached 87.6% accuracy and 94.8% specificity. These results prove that ongoing model evaluation helps maintain high-quality output in computer vision tasks.
Offline vs. Online Evaluation
Offline and online evaluation methods both support model evaluation machine vision system. Offline evaluation tests a system using stored data before deployment. This method often gives better predictive performance but needs more data processing and retraining. Online evaluation checks the system in real-time as new data arrives. It updates the machine learning pipeline quickly and adapts to changes.
Empirical studies show that offline models can achieve higher accuracy, but online models train faster and use less computational power. For example, offline models improved predictive performance by up to 3.68% over online models in some tasks. However, online evaluation helps the system respond to real-time data drift and changing environments.
Pixel resolution and system type (1D, 2D, 3D) also affect model evaluation. Higher resolution and more complex systems need more advanced data processing and recognition methods. Teams must choose the right evaluation approach for their machine vision systems to ensure reliable recognition and efficient processing in every machine learning pipeline.
Performance Metrics for Computer Vision

Performance metrics help researchers and engineers measure how well machine vision systems work. These metrics guide improvements in recognition, detection, and segmentation. They also help compare different models and choose the best one for a specific computer vision task. The right metric can highlight strengths and weaknesses, making it easier to improve system performance.
Classification Metrics
Classification metrics measure how well a model sorts images into categories. These metrics are essential for tasks like animal recognition or sorting objects in a warehouse. The most common image classification metrics include accuracy, precision, recall, and f1-score. Each metric tells a different part of the story.
| Metric | Definition / Interpretation | Formula / Range | Successful Performance Indicator |
|---|---|---|---|
| Accuracy | Proportion of correctly classified samples over total samples | Accuracy = Correct / Total | Close to 1 (or 100%) means high correct classification |
| Precision | Ratio of true positives to total predicted positives | Precision = TP / (TP + FP) | Close to 1 means few false positives |
| Recall | Ratio of true positives to total actual positives | Recall = TP / (TP + FN) | Close to 1 means few false negatives |
| F1-score | Harmonic mean of precision and recall | F1 = 2 * (Precision * Recall) / (Precision + Recall) | High f1-score indicates good overall classification |
Accuracy shows the percentage of correct predictions. However, in imbalanced datasets, accuracy can be misleading. Precision tells how many selected items are relevant, while recall shows how many relevant items are selected. The f1-score balances both precision and recall, making it useful when classes are uneven or when both false positives and false negatives matter.
A confusion matrix gives a detailed breakdown of correct and incorrect predictions for each class. It helps spot patterns in errors. The roc curve and auc score show how well the model separates classes at different thresholds. These tools help teams pick the best model for real-world recognition tasks.
Researchers often use datasets like ImageNet, MNIST, and CIFAR-10 to benchmark classification metrics. They also use statistical methods like confidence intervals and hypothesis testing to ensure results are reliable. Multiple independent runs and performance distributions help handle model variability.
Detection Metrics
Object detection and recognition tasks need special metrics to measure how well models find and classify objects in images. The most common object detection metrics are Intersection over Union (IoU) and mean Average Precision (mAP).
- IoU measures the overlap between the predicted bounding box and the ground truth box. A higher IoU means better localization. Usually, a threshold of 0.5 defines a correct detection.
- mAP averages the precision across all classes and IoU thresholds. This metric gives a complete view of detection and recognition performance.
IoU sets the standard for what counts as a correct prediction. mAP combines results from different IoU thresholds, making it a strong tool for comparing models. These metrics help teams adjust confidence thresholds and improve recall or reduce false positives.
Tip: Precision-recall curves and average precision scores help select the best threshold for object detection and recognition models.
Meta-analyses in medical imaging show that object detection and recognition models can reach high sensitivity and specificity. For example, diabetic retinopathy screening models report sensitivity above 90% and auc scores near 0.98, showing strong recognition abilities. These results confirm the value of robust object detection metrics in real-world applications.
Segmentation Metrics
Image segmentation metrics evaluate how well a model divides an image into meaningful parts. These metrics are vital for tasks like medical imaging or crime scene analysis. The most common metrics include pixel accuracy, Dice coefficient, Jaccard index (IoU), and mean IoU (mIoU).
- Pixel accuracy measures the proportion of correctly labeled pixels.
- Dice coefficient quantifies the similarity between predicted and true segments.
- Jaccard index (IoU) measures the overlap between predicted and actual segments.
- Mean IoU (mIoU) averages IoU across all classes.
| Metric Class | Description | Examples / Notes |
|---|---|---|
| Overlap Metrics | Measure volume overlap between segmentations | Dice coefficient, Jaccard index, sensitivity, specificity; widely used and intuitive but may miss fine details |
| Average Distance | Average boundary distance between segmentations | Mean surface distance, Hausdorff distance; useful for large or complex shapes |
Pixel accuracy and Dice coefficient are widely used in biomedical imaging and general computer vision. They provide clear, numerical assessments of segmentation quality. However, these metrics can be sensitive to small structures or complex shapes. Choosing the right metric depends on the task and the type of segmentation output.
Statistical models like Statistical Shape Models and machine learning methods such as SVMs and random forests support segmentation tasks. These models help ensure that segmentations are anatomically plausible and accurate.
Generation Metrics
Generative models create new images, so their evaluation needs different metrics. The most common are Inception Score (IS) and Fréchet Inception Distance (FID).
| Metric | Description | Calculation | Interpretation |
|---|---|---|---|
| IS | Measures image quality and diversity using InceptionV3 class probabilities | KL divergence between conditional and marginal class distributions | Higher IS means better quality and diversity |
| FID | Compares feature distributions of real and generated images | Fréchet distance between means and covariances of features | Lower FID means generated images are closer to real images |
IS checks if generated images are clear and varied. FID compares the distribution of generated images to real images, making it more comprehensive. Lower FID scores mean the generated images look more like real ones. However, both metrics have limitations. IS does not compare to real data, and FID depends on the choice of pretrained model and sample size.
Researchers often use human evaluation alongside these metrics to judge realism and creativity. They also compare models using the same datasets and metrics for fairness. Statistical tests confirm if differences in scores are meaningful.
Note: Overfitting to optimize FID can lead to unrealistic images, so teams should use multiple metrics and human judgment for a complete evaluation.
Performance Evaluation and Monitoring
Continuous Model Evaluation
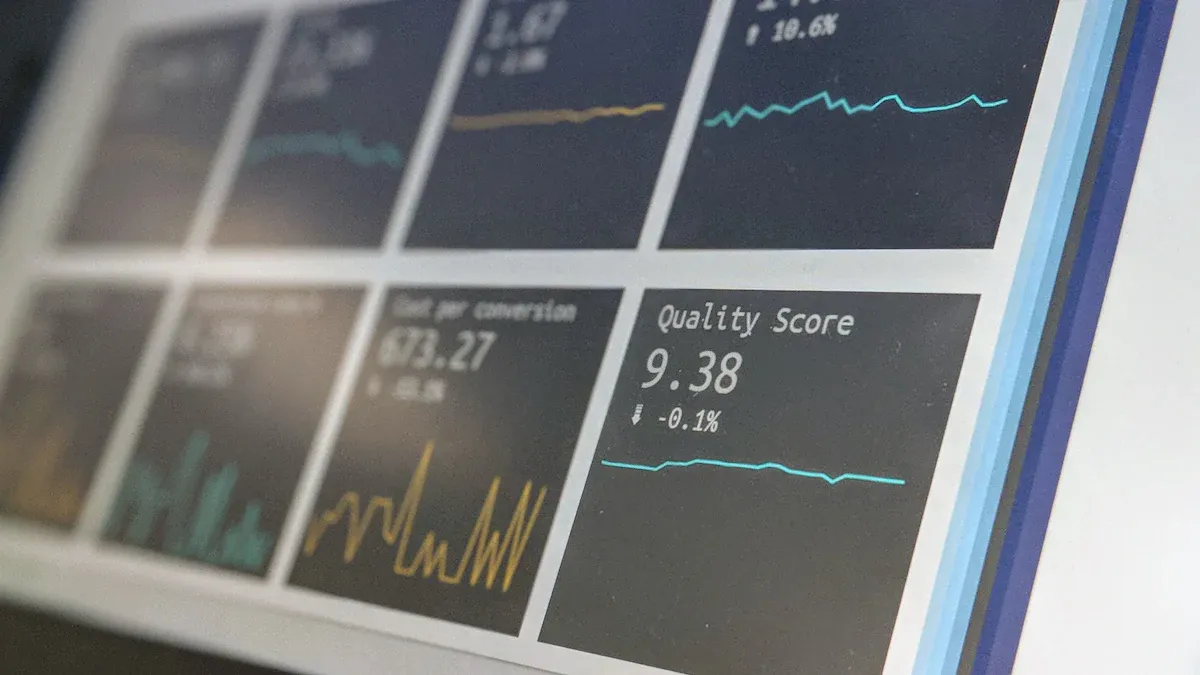
Performance evaluation in machine vision systems does not stop after deployment. Teams must check system performance both offline and in real-time. Continuous model evaluation helps catch problems early and keeps recognition tasks accurate. Recent reviews show that AI models in clinical settings, like fracture detection in x-rays, can lose accuracy over time. Changes in the environment or data can cause this drop. Real-time monitoring tracks input and output data, even when ground truth labels are missing. Systems like HeinSight2.0 use real-time image analysis and classification to adapt to new conditions. This approach keeps recognition and data processing strong, even as experiments change. Quantitative trends in metrics such as accuracy, recall, and F1 score help teams spot performance drops quickly.
Maintaining data freshness is important for continuous evaluation. However, it can increase computational costs and synchronization latency. Metrics like time-to-update and data recency ratio help measure how fresh the data is. Teams must balance the need for real-time evaluation with resource limits.
Data Drift and Model Bias
Data drift happens when the input data changes over time. This can hurt recognition and processing in machine vision systems. Types of drift include covariate shift, label shift, and domain shift. For example, a model trained on images from young patients may not work well on older patients. Statistical tests like the Kolmogorov-Smirnov test help detect drift. Bias can also appear, such as when object recognition models perform worse for certain groups. Monitoring variance and error rates helps teams find and fix these issues. Retraining and re-validation keep the system accurate over time. Domain adaptation and data augmentation are useful strategies to handle drift and bias.
| Scenario | Challenge | Role of Continuous Evaluation |
|---|---|---|
| No timely labels | Delayed outcomes, costly labeling | Data drift detection triggers re-evaluation and retraining only when needed |
| Timely labels with performance change | Performance metrics show degradation | Drift detection explains causes, supporting targeted fixes |
Real-World System Reliability
Real-time performance evaluation and monitoring keep machine vision systems reliable in real-world settings. Companies like Ford and General Motors use real-time monitoring tools to catch errors early. This reduces downtime and repair costs. Predictive maintenance based on monitoring data can extend system lifespan by up to 40%. In high-stakes areas like healthcare and autonomous vehicles, real-time monitoring prevents severe consequences from system errors. Metrics such as accuracy, precision, recall, and Gauge R&R help teams track system reliability. Operator training on dashboards improves response to alerts and keeps recognition and data processing effective. Real-world data shows that continuous monitoring detects drift and degradation early, allowing for quick retraining and recalibration.
Metric Selection and Best Practices
Aligning Metrics with Goals
Choosing the right metric for a machine vision system starts with understanding the business goal. Each metric highlights a different aspect of performance. For example, accuracy works well when classes are balanced, but it may not reflect true performance in imbalanced data. Precision becomes important when false positives are costly, such as in fraud detection. Recall matters most when missing a positive case is risky, like in medical diagnosis. The table below shows how different metrics align with specific goals:
| Metric | Definition / Calculation | Business Goal Alignment / Use Case |
|---|---|---|
| Accuracy | Correct predictions / Total predictions | Balanced classes; image recognition |
| Precision | TP / (TP + FP) | Minimize false alarms; fraud detection |
| Recall | TP / (TP + FN) | Minimize missed cases; medical diagnosis |
| F1 Score | Harmonic mean of Precision and Recall | Balance both errors; general classification |
| AUC (ROC) | Area under ROC curve | Imbalanced data; robust threshold selection |
| Specificity | TN / (TN + FP) | Avoid false alarms; disease screening |
| MAE/RMSE | Regression error metrics | Regression tasks; sales or price prediction |
Standard image quality metrics like PSNR or SSIM often show weak correlation with system goal achievement. Task-specific, CNN-based metrics provide much stronger predictive power for detection and recognition.
Cross-Validation and Overfitting
Cross-validation helps a machine vision system avoid overfitting. This process splits data into several parts, trains on some, and tests on others. K-fold cross-validation divides data into k groups, rotating the test group each time. This method gives a better estimate of how the system will perform on new data. Stratified sampling ensures each fold has a similar class distribution. Using multiple metrics, such as accuracy, F1-score, and AUC, gives a complete view of system performance. Advanced techniques like nested cross-validation further reduce bias, especially during hyperparameter tuning. Early stopping in the machine learning pipeline prevents memorizing noise. These practices help the system generalize and stay reliable.
Cross-industry benchmarks show that cross-validation, stratified folds, and multiple metrics are key to robust model evaluation and reducing overfitting.
Practical Recommendations
A robust machine vision system uses a mix of metrics and validation strategies. For classification, teams should track accuracy, F1-score, and precision-recall curves. For regression, MAE and RMSE measure prediction errors. Clustering tasks benefit from Silhouette Score or Adjusted Rand Index. In anomaly detection, F1-score and precision-recall curves are useful. Teams should monitor data drift and retrain the machine learning pipeline as needed. Regularly updating the system with new data keeps processing accurate. Choosing the right metric and validation method ensures the system meets business goals and adapts to changing data.
Selecting the right performance metrics shapes the success of every computer vision system. Teams must track accuracy, precision, and recall to understand how models handle real-world data. Continuous evaluation helps spot drops in accuracy and reveals hidden issues in minority classes.
- Balanced accuracy and confusion matrices show how well models work with imbalanced data.
- Automated testing and simulation environments test accuracy and data reliability.
- Validation methods like k-fold cross-validation and bootstrapping keep accuracy high as data changes.
- Real-world monitoring tracks accuracy and data drift over time.
- AI-driven tools and human testers both check data quality and accuracy.
- Data from learning curves and calibration curves guide improvements.
- Data augmentation and automated test cases adapt models to new data.
- Data from CI/CD pipelines supports fast updates and accuracy checks.
- Data analysis with ROC-AUC and F1 score ensures robust accuracy.
As data evolves, teams should update evaluation strategies. How does your team measure accuracy and adapt to new data in machine vision systems?
FAQ
What is the difference between accuracy and F1-score?
Accuracy shows the percentage of correct predictions. F1-score balances precision and recall. F1-score works better when classes are uneven or when both false positives and false negatives matter.
Why do machine vision systems need continuous evaluation?
Machine vision systems face changing data and environments. Continuous evaluation helps teams catch drops in performance early. This process keeps the system reliable and accurate over time.
How does data drift affect model performance?
Data drift means the input data changes over time. Models may start making more mistakes. Teams use monitoring tools to spot drift and retrain models to keep performance high.
Which metric should teams use for object detection tasks?
Teams often use Intersection over Union (IoU) and mean Average Precision (mAP) for object detection. IoU measures overlap between predicted and true boxes. mAP gives an overall score for detection accuracy across all classes.
See Also
A Comprehensive Guide To Object Detection In Machine Vision
An Overview Of Computer Vision Models And Systems
Fundamentals Of Metrology In Machine Vision Technologies
Comparing Firmware-Based And Traditional Machine Vision Systems
Understanding Image Processing Within Machine Vision Systems


