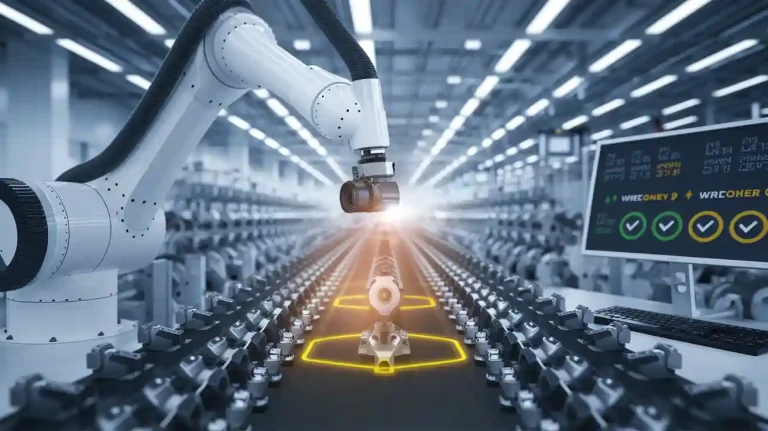
A/B testing machine vision system empowers manufacturers to compare and optimize automated vision inspection tools on the factory floor. Automated vision inspection achieves repeatability and reproducibility rates that match calibrated standards, with measurement differences as low as 0.01 mm. Artificial intelligence and machine learning drive these advances by automating data cleaning, anomaly detection, and predictive quality control. Automated vision inspection leverages artificial intelligence for real-time decision-making and improved accuracy. With learning algorithms, automated vision inspection adapts quickly to new defect types. The machine vision pipeline integrates artificial intelligence and learning, making visual inspection more efficient and reliable.
Key Takeaways
- A/B testing compares two machine vision systems by splitting data into groups to find which system detects defects better and improves quality control.
- Key metrics like accuracy, precision, recall, and defect detection rate help measure and compare the performance of vision inspection systems effectively.
- Defining clear success metrics and preparing fair test groups with random assignment ensures reliable and unbiased A/B test results.
- Integrating A/B testing with machine vision pipelines speeds up improvements, reduces errors, and supports continuous learning and adaptation.
- Addressing challenges like data variability and production integration with best practices helps maintain system accuracy and smooth operation.
A/B Testing Machine Vision System
Definition and Purpose
A/B testing machine vision system refers to a structured approach for comparing two different inspection solutions. In this process, engineers split a dataset into two groups. One group uses the current system (A), while the other group uses a new or modified system (B). Each group inspects the same types of products under similar conditions. This method uses random assignment to ensure fairness and reduce bias. Statistical hypothesis testing, including confidence intervals and p-values, helps determine if one system performs better than the other. A p-value below 0.05 often signals that the difference is real and not due to chance. This approach allows manufacturers to make evidence-based decisions and improve their visual inspection processes. By filtering out random noise, A/B experiments help teams identify genuine improvements in quality control.
Key Metrics
A/B testing machine vision system relies on several key metrics to measure performance. These metrics help teams compare results and select the best inspection solution.
| Metric | Definition and Role in Defect Detection |
|---|---|
| Accuracy | Percentage of total correct predictions (defects and non-defects). |
| Precision | Proportion of detected defects that are actual defects. |
| Recall | Proportion of real defects found out of all possible defects. |
| F1-Score | Harmonic mean of precision and recall, balancing both metrics. |
| Escape Rate | Rate of defective parts missed by the system (false negatives). |
| Overkill Rate | Rate of good parts incorrectly classified as defective (false positives). |
| ROC Curve | Graph of true positive rate vs false positive rate, showing model quality. |
| AUC | Single number summarizing ROC curve performance. |
Manufacturers use these metrics to evaluate deep learning classifiers and reduce the number of defective products. For example, a ResNet-50 model for welding defect detection achieved 96.1% accuracy. In another case, a YOLOv5 model reached 98.1% detection accuracy for vehicle counting. These results show how a/b testing machine vision system can drive improvements across industries.
A/B experiments in manufacturing use these metrics to benchmark systems and ensure reliable visual inspection. By tracking accuracy, recall, and defect detection rates, teams can minimize both missed defects and unnecessary rejections.
Benefits and Applications
Model Selection
Selecting the right model for automated vision inspection requires careful planning. Teams must understand the data and the specific needs of each case. They often use the following strategies:
- Teams check if the dataset matches real-world conditions and includes rare or unusual cases.
- Dataset requirements change based on metadata, task complexity, and available labeling resources.
- Sampling methods like diversity-based sampling, uncertainty-based sampling, and active learning help teams choose the best data for model training.
- Tools such as LightlyOne allow similarity searches and metadata queries to find under-represented cases and automate updates to the data pipeline.
- Teams update training datasets regularly to keep up with new products or changing environments, making sure automated vision inspection stays effective.
- Smaller, well-chosen datasets can be more useful than large, repetitive ones, especially when labeling and processing take a lot of time.
- Automated, machine-driven selection methods ensure the data covers many scenarios, which manual sampling might miss.
- Each selection process fits the specific task, industry, and company resources, showing the importance of case-specific data in automated vision inspection.
Performance Benchmarking
Performance benchmarking gives teams a clear way to measure how well automated vision inspection works. They use benchmark datasets with ground-truth labels to compare model results to known answers. Datasets like MNIST, CIFAR-10/100, and VEDAI reflect real-world challenges. Teams use metrics such as accuracy, precision, and recall to judge performance. Multi-fidelity Test and Evaluation frameworks help tailor tests to each application and learning method. In automated vision inspection, teams set clear, measurable goals that match business needs. They run experiments with enough samples and analyze the results to improve the system. This process helps teams set strong benchmarks and keep improving automated vision inspection through repeated experiments and learning.
Fairness and Bias Testing
Automated vision inspection must treat all products and people fairly. Bias can appear in training data or models, so teams test for fairness using several methods:
- Bias amplification measures how much a model increases existing biases in the data.
- Studies show gender and geographic biases in large datasets, which can affect model fairness.
- Annotation biases in facial image datasets can cause gender-related differences in results.
- Large datasets sometimes contain hate content, which can impact fairness.
- Researchers have found gender and skin-tone biases in commercial face recognition systems and object detection models.
- Training methods like self-supervised learning or model compression can increase bias, affecting some groups more than others.
A new statistical testing framework now helps teams measure fairness in automated vision inspection. It uses cross-validation and confusion matrices to give clear, measurable results for individual, group, and subgroup fairness. This approach helps teams make sure automated vision inspection systems work well for everyone and improve visual inspection quality.
Implementation Steps
Define Metrics
Teams begin by defining clear success metrics for the machine vision system. These metrics guide the entire A/B testing process and ensure that results are meaningful. When setting up tests, teams select metrics that match the project’s goals and the specific inspection task. Using multiple metrics helps capture different aspects of performance, especially when the dataset is imbalanced or when the cost of errors varies.
- Precision measures how often the system correctly identifies defects, which matters when false positives are expensive.
- Recall checks if the system finds all real defects, which is important when missing a defect is costly.
- F1 Score balances precision and recall, making it useful for tasks with uneven data.
- AUC (Area Under the Curve) shows how well the system separates defective from non-defective items.
- For regression tasks, teams use Mean Absolute Error (MAE), Mean Squared Error (MSE), Root Mean Squared Error (RMSE), R-squared (R2), and Mean Absolute Percentage Error (MAPE).
- Additional metrics include Defect Detection Rate, percentage of critical defects found, and satisfaction surveys from users.
Tip: Teams should automate data collection and reporting. This saves time and increases accuracy. Presenting metrics in simple charts or tables helps both technical and management teams understand the results.
Prepare Groups
After defining metrics, teams prepare the groups for testing. They split the dataset into two groups: one for the current system (A) and one for the new or improved system (B). Random assignment ensures that each group represents the full range of product types and defect cases. This step reduces bias and supports fair comparison.
Best practices recommend using randomization tests, where group labels are shuffled many times to create a null distribution. This approach does not rely on strict statistical assumptions and helps teams check if observed differences are real. Teams also normalize data across different batches to maintain consistency and reproducibility.
Note: Proper dataset splitting and validation are crucial. Teams should use cross-validation and external test sets, especially with small datasets. This prevents misleading results and ensures that the system’s performance reflects real-world conditions.
Run Tests
With groups prepared, teams deploy both versions of the machine vision system. Each group inspects the same types of products under similar conditions. Teams collect data on all defined metrics during the test period. Automated data pipelines help gather results in real time, reducing manual errors.
Teams monitor the process to ensure that both systems operate under identical settings. This includes lighting, camera angles, and product flow. Any changes in the environment can affect results and must be controlled.
Analyze Results
Once testing ends, teams analyze the collected data. They use statistical hypothesis testing to compare the performance of both systems. P-values show if the difference between systems is likely due to chance. However, teams also look at effect size metrics, such as Cohen’s d, to measure the practical impact of any improvement.
Teams present results using clear charts and tables. They check if the new system improves accuracy, recall, or other key metrics. Teams also review fairness and bias, ensuring that the system works well for all product types and does not favor certain groups.
Reminder: Teams should not rely only on P-values. They must consider both statistical and practical significance. Continuous verification of metrics ensures that results remain valid and actionable.
Make Decisions
Based on the analysis, teams decide whether to adopt the new system. If the new system shows clear improvements in accuracy, defect detection, or efficiency, teams can move forward with deployment. If results are mixed, teams may run additional tests or refine the learning algorithms.
Teams document the entire process, including metric definitions, data splits, and analysis methods. This documentation supports reproducibility and helps future teams repeat or improve the process. Teams also gather feedback from operators and stakeholders to ensure the system meets real-world needs.
Pro Tip: Continuous improvement is key. Teams should repeat A/B testing as new data, products, or learning methods become available. This keeps the machine vision system up to date and effective.
Machine Vision Pipeline
System Components
A machine vision pipeline includes several core components that work together to inspect products automatically. Each part plays a specific role in capturing, processing, and analyzing images. The table below outlines the main components and their technical details:
| Component | Description & Technical Details |
|---|---|
| Illumination | Uses LED, fluorescent, or fiber optic halogen lights to improve image quality and highlight features. |
| Industrial Camera | Captures images in formats like monochrome, color, or high-resolution, using CCD or CMOS sensors. |
| Lenses | Focuses and magnifies images, with options for different mounts and fields of view. |
| Sensors | Detects object position and triggers image capture, using fiber optic or proximity switches. |
| Frame Grabber | Converts camera signals to computer data and controls camera settings like exposure and trigger. |
| Computing Platform | Runs processing software on industrial PCs, balancing speed and reliability for factory use. |
| Processing Software | Analyzes images, extracts features, and makes decisions using advanced algorithms and learning models. |
| Control Unit | Manages system operations, including motion control and input/output tasks. |
Teams can measure the impact of each component. For example, image acquisition and preprocessing speed affect real-time inspection, with some systems processing images in under 20 milliseconds. Feature extraction and object detection use metrics like Average Precision and Recall to track accuracy. Decision-making and reporting can reduce incidents by up to 20% and lower inspection costs by 30%. Integration with the data pipeline supports real-time data flow and predictive maintenance.
Integration with A/B Testing
Integrating A/B testing into the machine vision pipeline brings many advantages. AI-driven A/B testing automates test setup, real-time tracking, and variant generation. This speeds up the process and allows teams to test new algorithms or hardware quickly. For example, a commercial visual search system can use A/B testing to compare different feature extraction methods or lighting setups.
AI tools help reduce manual errors and cognitive bias. They enable teams to run multivariate tests, checking several variables at once. This approach provides deeper insights than traditional single-variable tests. AI also detects anomalies in data, ensuring reliable results and maintaining system integrity.
Teams benefit from predictive capabilities. AI can forecast outcomes and optimize inspection settings instantly. This supports continuous improvement and learning in the pipeline. Companies like Airbnb have seen measurable gains, such as a 6% increase in booking conversions, by using AI-enhanced A/B testing. In manufacturing, these methods help teams adapt quickly to new defect types and changing production needs.
Tip: Integrating A/B testing with the machine vision pipeline ensures that every change is validated with real data, leading to better accuracy and efficiency.
Challenges and Best Practices
Data Variability
Automated vision inspection faces significant challenges from data variability. Input data can change due to lighting, background, perspective, and material properties. These changes can impact inspection accuracy. For example, a synthetic test dataset with high variability in perspective and lighting helps measure how well models handle real-world conditions. Models trained with complex materials that introduce more variance achieve higher accuracy on variable datasets. In contrast, models trained on photo-realistic textures or random colors often fail to generalize.
Combining 2D and 3D data pipelines can reduce the impact of object pose and location. Pre-processing steps register raw data to a reference template, which helps standardize inputs. Self-supervised Denoising Autoencoder networks learn the distribution of acceptable parts and detect anomalies by reconstructing inputs. Adding noise during training improves robustness and reduces overfitting. Automated vision inspection systems must monitor true positive, false negative, true negative, and false positive rates to evaluate how input variability affects detection.
Tip: Using Principal Component Analysis (PCA) can help reduce noise and redundancy in high-dimensional data, making automated vision inspection more robust to changes in lighting and orientation.
Production Integration
Integrating automated vision inspection into production environments introduces technical and operational challenges. Concept drift, where data distributions change over time, can degrade model performance. Data quality issues in production data may cause unexpected errors or biases. Infrastructure challenges such as latency, failures, and traffic spikes can affect model availability.
Best practices for production integration include:
- Model versioning and containerization to manage updates and rollbacks.
- Choosing the right deployment infrastructure, such as cloud, on-premises, or edge computing.
- Monitoring pipelines with logging, alerts, and dashboards to track model health.
- Regular retraining with fresh data and feedback loops to maintain performance.
- Running A/B tests on multiple model versions to identify the best-performing system.
Automated vision inspection benefits from these practices by ensuring reliable operation and continuous improvement.
Change Management
Managing changes in automated vision inspection systems requires careful planning and collaboration. Teams should use stratified cluster randomization to align randomization with reporting levels, reducing the impact of organizational changes. Multidisciplinary teams and strong institutional support foster buy-in from stakeholders.
A repeatable, agile process that combines user-centered design with randomized controlled trial methods enables rapid, iterative evaluation. Teams should balance usability testing, which is resource-intensive, with rapid A/B testing for quick feedback. Starting with less invasive design changes helps build confidence before making major modifications. Collaboration with system vendors can enhance randomization and reporting infrastructure.
Note: Automated vision inspection projects succeed when teams anticipate contamination bias, use rapid evaluation frameworks, and adapt quickly to operational changes.
Case Study
Manufacturing Example
A leading electronics manufacturer wanted to improve its automated vision inspection process for detecting soldering defects on circuit boards. The team designed an A/B test to compare the current inspection system with a new deep learning-based solution. Engineers split the production line so that half of the boards went through the existing system, while the other half used the new automated vision inspection setup. Both systems operated under identical lighting and environmental conditions. The team collected data for four weeks, covering multiple production cycles to ensure a representative sample.
They tracked several outcome metrics, including accuracy, defect detection rate, and false positive rate. The team calculated the required sample size before starting the experiment, aiming for at least 400 inspected boards per system. This approach helped avoid premature conclusions and ensured statistical rigor. The team also monitored guardrail metrics, such as inspection speed and system downtime, to confirm that improvements in defect detection did not come at the expense of operational efficiency.
Outcomes
The A/B test produced clear results. The new automated vision inspection system achieved a 97.2% defect detection rate, compared to 93.5% for the legacy system. Statistical analysis showed a p-value below 0.05, meeting the 95% confidence threshold for significance. The team applied multiple testing corrections to control false-positive rates. No guardrail metrics deteriorated, and quality checks confirmed the experiment’s integrity.
Key findings included:
- The new automated vision inspection system improved accuracy and reduced false negatives.
- All guardrail metrics remained stable, with no increase in inspection time or downtime.
- The experiment met all statistical requirements, including sample size and duration.
- Psychometric validation confirmed the reliability of outcome metrics.
The manufacturer decided to deploy the new automated vision inspection system across all production lines, confident in the data-driven results.
A/B testing brings measurable gains to automated vision inspection. Teams see up to 10% improvement in conversion rates and 20% lower bounce rates when they use automated vision inspection with data-driven methods. Leading brands trust automated vision inspection for its speed and accuracy. To maximize results, teams should:
- Set clear goals for automated vision inspection.
- Formulate testable hypotheses.
- Prioritize high-impact tests.
- Maintain statistical rigor.
- Analyze all results, including guardrail metrics.
- Treat each automated vision inspection test as a learning opportunity.
- Build a culture of experimentation.
| Metric | Benefit | Recommendation |
|---|---|---|
| Testing Cycle Time | 30% faster iteration cycles | Foster rapid learning and iteration |
| Statistical Confidence | 95%+ confidence trusted by 75% | Adhere to best practices |
Automated vision inspection, powered by A/B testing, helps manufacturers achieve continuous improvement and smarter decision-making.
FAQ
What is A/B testing in machine vision quality inspection?
A/B testing compares two machine vision systems by splitting data into two groups. Each group uses a different system. Teams measure which system finds more defects or works faster. This helps manufacturers choose the best solution.
How do teams ensure fairness in A/B tests?
Teams use random assignment and cross-validation. These methods help remove bias from the results. They also check for fairness across different product types and conditions.
Which metrics matter most in A/B testing for vision systems?
Key metrics include accuracy, recall, precision, and defect detection rate. Teams also track false positives and false negatives. These numbers show how well each system works.
Tip: Teams should use simple charts to compare metrics. This makes results easy to understand.
Can A/B testing slow down production?
A/B testing does not need to slow production. Teams run tests on live lines or use historical data. Careful planning keeps inspection speed and quality high during experiments.
See Also
Understanding Machine Vision Systems For Quality Assurance
Improving Product Quality Through Surface Inspection Vision Systems
Capabilities Of Machine Vision Systems In Detecting Defects
Ensuring Accurate Part Identification With Machine Vision Technology
Effective Equipment Placement Strategies For Machine Vision Systems