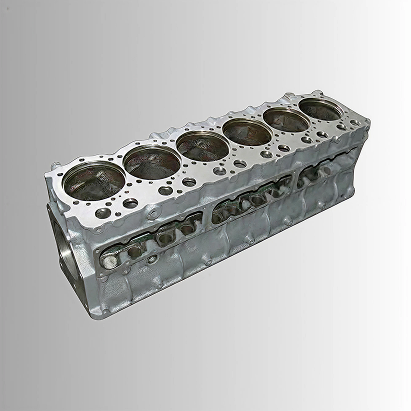
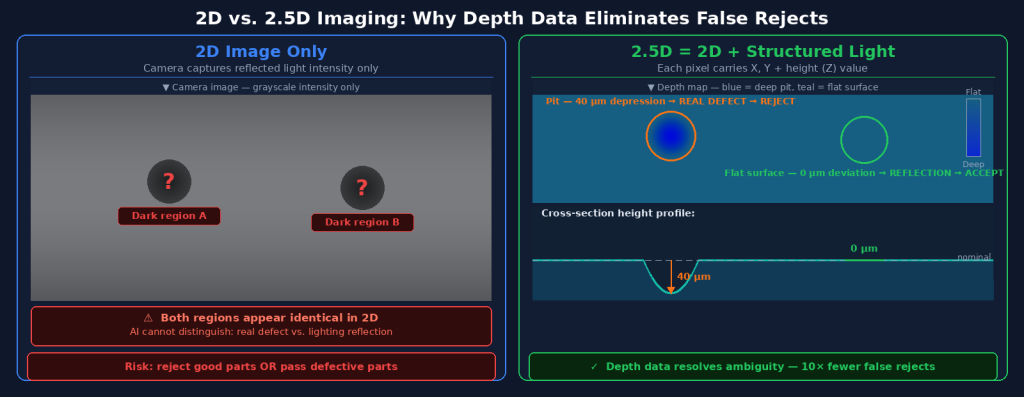
Consider an aluminum housing with a machined surface. Under 2D inspection, your camera captures a high-resolution image of the surface. But on a highly polished aluminum surface, light doesn’t behave simply — it reflects differently depending on micro-surface orientation, and what looks like a defect shadow from one angle is indistinguishable from a genuine surface pit from another. Your AI model, however well-trained, is working with ambiguous information.
Now add 2.5D imaging. The system captures not just surface appearance but a per-pixel height map — the actual topography of the surface, measured in micrometers. The AI model now knows: that suspicious dark region has no depth deviation — it’s a reflection artifact. That other region, 3mm away, has a 40μm depression — that’s a real pit. One is a false positive. One is a genuine defect. 2D can’t reliably distinguish them. 2.5D can.
Key Takeaways
- 2D imaging captures surface appearance only; 2.5D adds per-pixel height data, enabling detection of geometric defects (pits, burrs, deformations) that are invisible or ambiguous in flat images.
- Reflective surfaces are the primary failure mode of 2D inspection — specular reflections create false positive signals that are structurally indistinguishable from real defects in grayscale images.
- 2.5D imaging resolves the appearance/geometry ambiguity, dramatically reducing false rejection rates on metal parts, polished surfaces, and complex geometries.
- True 3D imaging provides more data but is overkill for most inline production inspection — 2.5D delivers the depth information needed for defect classification at practical line speeds and costs.
What 2D Inspection Captures — and What It Misses
The Capabilities of 2D Imaging
Standard 2D machine vision captures a two-dimensional projection of the part’s surface: intensity values (in grayscale or color) at each pixel position. This is sufficient — and excellent — for a wide range of inspection tasks. Presence/absence checks, color verification, barcode reading, label inspection, and flat-surface cosmetic defects like contamination, staining, or printing errors are all well-served by 2D imaging.
The fundamental limitation is that a 2D image contains no direct information about the third dimension — height. A 0.5mm deep pit and a 0.5mm light-colored paint mark may produce nearly identical pixel intensity patterns in a 2D image. The AI model’s only way to distinguish them is through subtle, indirect visual cues: shadow patterns, texture gradients, reflection characteristics — all of which vary depending on lighting angle, surface finish, and ambient conditions.
The Reflectivity Problem
Reflective surfaces amplify this limitation dramatically. On machined aluminum, polished stainless steel, chrome-plated components, or glossy injection-molded plastics, the surface itself generates complex, spatially varying intensity patterns that have nothing to do with defects. Specular highlights, shadow gradients from surface microtopography, and reflection of nearby objects create signals in the 2D image that a classifier trained to detect dark regions or intensity anomalies will flag as potential defects.
The industry data on this problem is clear: inspection systems without depth information report false positive rates on reflective surfaces that can reach 5–15% — meaning 5–15 parts per 100 are rejected despite being functionally and cosmetically acceptable. For a production line running 10,000 parts per shift, this represents 500–1,500 false rejects per shift requiring manual re-inspection, which erodes the labor savings that automated inspection was meant to deliver.
How 2.5D Imaging Works
Structured Light and Depth Measurement
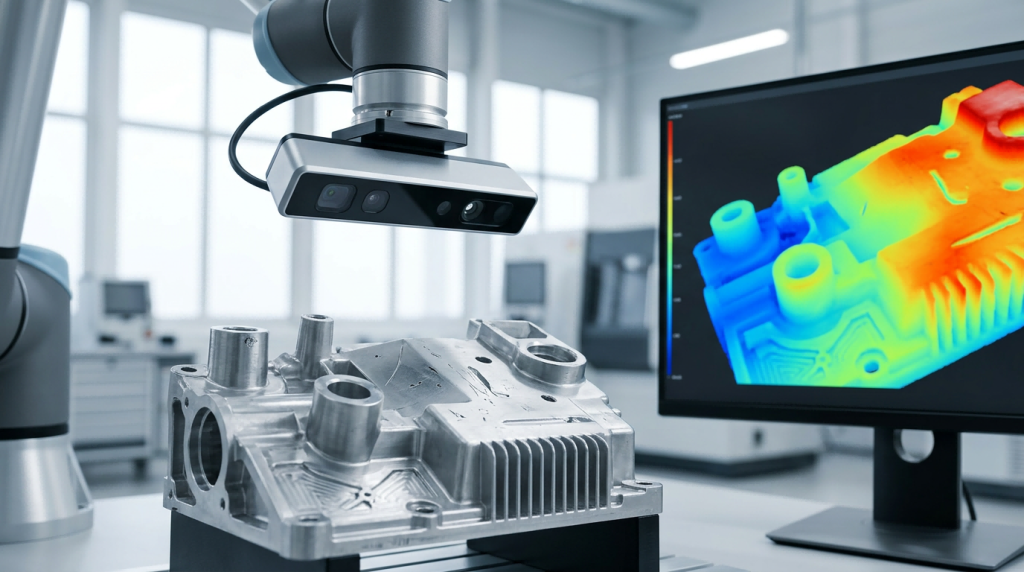
2.5D imaging captures both the standard 2D intensity image and a per-pixel depth (Z-axis) measurement. The most common method in industrial applications is structured light projection: the imaging system projects a known light pattern (typically a set of parallel stripes or sinusoidal fringes) onto the surface, and the camera captures how this pattern deforms due to surface topography. Phase-demodulation algorithms then compute the height at each pixel from the pattern deformation.
An alternative is stereo vision — using two cameras at different angles to compute depth from disparity. Structured light is generally preferred for industrial inspection because it is more accurate on surfaces with limited natural texture (like smooth machined metals), which are precisely the surfaces where 2.5D data is most needed.
The Depth Map Output
The output of 2.5D imaging is a depth map: an image of the same dimensions as the 2D intensity image, where each pixel’s value represents the measured height at that surface location. Combined with the intensity image, this gives the AI model a complete description of each surface location: what it looks like (appearance) and what shape it is (geometry).
OptiX’s 2.5D capability achieves 3μm z-repeatability at 500mm field of view — sufficient to detect the sub-millimeter pits, burrs, and deformations that are the critical defects in precision-machined and stamped metal parts. This measurement precision is maintained across OptiX’s full line speed range, including fly capture at 1.0 m/s.
Where 2.5D Makes the Decisive Difference
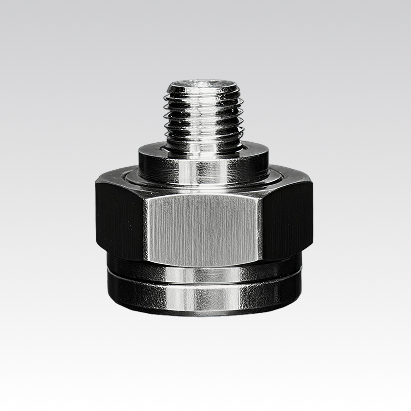
Case Study: Aluminum Housing Inspection
One representative application is the inspection of die-cast aluminum housings for automotive components. These parts have complex surface geometries, machined features at multiple depths, and highly reflective surfaces that change character depending on the cutting parameters and coolant residue from machining. A 2D-only system on this application faces a fundamental challenge: the same 2D pixel pattern can result from a genuine pit (machining defect, structural concern) or from a surface reflection highlight (cosmetic appearance, acceptable).
With 2.5D imaging, the distinction is direct: a genuine pit has a measured depth deviation of 20–100μm below the nominal surface; a reflection highlight has zero depth deviation. The AI model receives both channels and learns to require depth evidence for pit classification, virtually eliminating the false positive signal from reflection artifacts. The result is a dramatically cleaner inspection — one UnitX deployment on this part type achieved 10× reduction in false acceptance rate on critical defects while simultaneously reducing false rejection from 6% to under 1%.
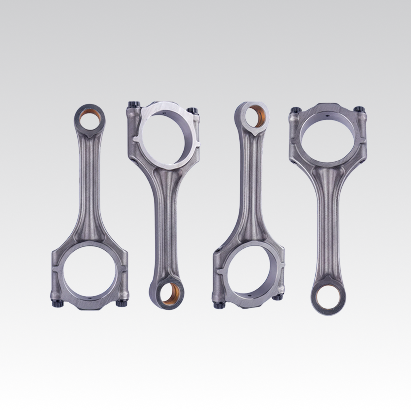
Burr Detection on Machined Parts
Burrs — small raised protrusions left at edges after machining or stamping — are another defect type where 2D imaging is inadequate. A burr has a positive height deviation (it protrudes above the nominal surface) rather than a depression. In a 2D image, burrs may be invisible against a background of normal edge features, because they produce similar intensity patterns to chamfers, radii, and reflections. In a 2.5D depth map, burrs appear as clearly elevated regions above the surrounding surface — distinctive, unambiguous, and measurable.
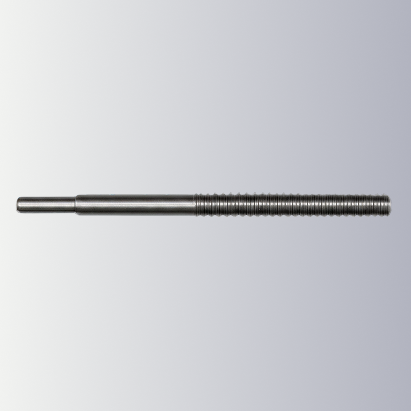
Coating and Plating Thickness Verification
2.5D imaging can also verify coating uniformity: a thin-coat region will measure at a slightly lower height than a properly coated region (relative to a reference datum), while a thick-coat region or a drip will appear elevated. This capability extends inspection beyond defect detection into process monitoring — using the same imaging system to verify that the coating process operated within specification.
2D vs. 2.5D vs. 3D: Choosing the Right Approach
| Criterion | 2D Imaging | 2.5D Imaging | True 3D (CT/Laser Scan) |
|---|---|---|---|
| Surface appearance defects | ✅ Excellent | ✅ Excellent | ✅ Good |
| Geometric defects (pits, burrs) | ❌ Poor on reflective | ✅ Excellent | ✅ Excellent |
| Reflective surface performance | ❌ High false positive | ✅ Resolves ambiguity | ✅ Good |
| Inline line speed compatibility | ✅ High speed | ✅ High speed (OptiX: 1.0 m/s) | ❌ Typically slow |
| Internal defect detection | ❌ Surface only | ❌ Surface only | ✅ Full volumetric |
| System cost / complexity | Low | Medium | High |
| Best for | Labels, presence, flat surfaces | Machined metal, castings, stamped parts | Internal voids, complex assemblies |
Why True 3D Is Often Overkill for Production Inspection
True 3D imaging systems — CT scanners, structured light scanners, laser profilometers — provide volumetric data that can detect internal defects, complex geometric deviations, and subsurface features. For inspection of complex forgings, castings with internal porosity risk, or assemblies where internal fit matters, 3D is the appropriate tool.
For inline surface inspection of production parts, however, true 3D is typically overkill for two reasons. First, cycle time: a CT scan takes seconds to minutes per part, incompatible with production line speeds measured in parts-per-minute. Second, cost and complexity: full 3D scanning systems are significantly more expensive and require more intensive operator expertise than 2D or 2.5D systems.
2.5D imaging occupies the practical sweet spot: it adds the depth information that resolves the ambiguities 2D inspection cannot handle, at line-compatible speeds, without the cost and complexity of full volumetric scanning. For most high-volume surface inspection applications, it is the right answer.
→ Learn how OptiX’s 2.5D imaging integrates with CorteX AI inference for complete inline inspection: OptiX imaging system.
→ Have a challenging reflective or geometric inspection application? Talk to UnitX experts — we’ll tell you whether 2D, 2.5D, or a combined approach is right for your use case.
Frequently Asked Questions
Does 2.5D imaging work on all surface types?
Structured light 2.5D imaging works best on diffusely reflective or partially reflective surfaces. Highly specular (mirror-like) surfaces can cause measurement errors because the projected light pattern does not scatter toward the camera. For these cases, techniques like multi-angle illumination or polarized light can reduce specular reflectance to the point where structured light measurement becomes reliable. OptiX’s 32-channel illumination system includes polarization options specifically for this purpose.
What does “3μm z-repeatability” mean in practice?
Z-repeatability is the standard deviation of repeated height measurements at the same point on a stationary surface. 3μm means that if you measure the same pit 100 times, the measured depth values will fall within approximately ±6μm of the true value (2 standard deviations). For typical production defects — pits and burrs in the 20–500μm range — this precision is more than sufficient to reliably classify defects above specification limits with high confidence.
Can 2.5D data be combined with AI defect detection?
Yes — in fact, this combination is what makes 2.5D inspection most powerful. The depth channel is treated as an additional input to the AI segmentation model, alongside the 2D intensity image. The model learns to use both channels together: appearance cues for classification, depth cues for confirmation and false positive rejection. The training process is identical to 2D-only training, except that training images include the depth channel. No specialized AI expertise is required to add 2.5D to an existing inspection deployment.