A logistic regression machine vision system uses statistical science to make sense of images. Many industries rely on logistic regression for both binary and multiclass classification tasks. In 2025, these systems achieve up to 94.58% accuracy and a 0.85 AUC score on complex datasets. The table below shows how logistic regression compares to other models:
| Metric / Method | Result / Improvement |
|---|---|
| Hybrid Distillation Accuracy | Up to 94.58% |
| Logistic Regression AUC | 0.85 on complex image retrieval datasets |
| Classification Accuracy (Sigmoid/Softmax) | 92.8% improvement |
Logistic regression remains a core tool in science for interpretable and reliable decisions. Binary logistic regression gives clear answers, but more complex data may require advanced models.
Key Takeaways
- Logistic regression offers clear, fast, and interpretable results, making it ideal for machine vision tasks with simple or small datasets.
- It helps industries like manufacturing and healthcare detect defects, classify objects, and analyze medical images with high accuracy and low error rates.
- The model is easy to build, requires less computing power, and works well in real-time applications where quick decisions matter.
- Logistic regression struggles with very large or complex image data, where deep learning and other advanced models often perform better.
- Following best practices like tuning parameters, standardizing data, and using balanced classes improves logistic regression’s reliability and fairness.
Logistic Regression Machine Vision System
What Is Logistic Regression?
Logistic regression stands as a core method in data science and machine learning. This algorithm helps predict the probability of an event, such as whether an object in an image belongs to a certain class. The logistic regression function transforms input data into a value between 0 and 1, making it ideal for binary outcomes. In science, logistic regression is not limited to binary tasks. It also supports multinomial and ordinal classification, which means it can handle more than two categories or ordered outcomes.
Researchers often use logistic regression in machine vision systems because it provides clear, interpretable results. The logistic regression model assumes that each outcome is independent and that the relationship between predictors and the outcome closely matches reality. For example, in spam email detection, logistic regression can classify emails as spam or not spam based on features in the data. The model can also adjust its cutoff to balance false positives and false negatives, which is important in real-world applications.
| Aspect | Description |
|---|---|
| Logistic Regression Model Assumptions | 1. The model relating the probability to predictors closely resembles the true relationship. 2. Each outcome is independent of others. |
| Application Example | Spam email classification into three probability categories: – Probability < 0.05: Email likely not spam. – Probability > 0.95: Email likely spam. – Probability in between: Uncertain classification. |
| Numerical Evidence | Using a 0.95 cutoff for spam classification, among 100 emails classified as spam, about 5 legitimate emails may be misclassified (5% error rate). Raising cutoff to 0.99 reduces false positives but increases false negatives. |
| Dataset Size | 3,921 emails used to fit the logistic regression model, providing a substantial data basis for the analysis. |
| Practical Considerations | Balancing false positives and false negatives is crucial to effective spam filtering, demonstrating logistic regression’s practical utility in classification tasks. |
How It Works in Vision Systems
A logistic regression machine vision system uses the logistic regression model to analyze image data and make decisions. The algorithm applies the logit function, which converts the odds of an event into a continuous scale. This transformation allows the model to relate input features, such as pixel values, to the probability of a specific outcome. The system then uses Maximum Likelihood Estimation (MLE) to find the best coefficients for each feature. MLE works by minimizing the difference between predicted and actual outcomes, using a process called Iteratively Reweighted Least Squares (IRLS).
In practice, logistic regression in machine learning offers probabilistic outputs and interpretable coefficients. This makes it valuable for tasks where understanding the likelihood of different outcomes is important. For example, in medical imaging, the model can estimate the probability that a region in an image shows signs of disease.
- A large-scale benchmark compared logistic regression and random forest on 243 real-world binary classification datasets from science and data science fields.
- Logistic regression remains a standard method for binary classification, especially when interpretability matters.
- Random forest outperformed logistic regression in about 69% of datasets, but logistic regression still serves as a reliable baseline.
- The benchmark design aimed to reduce bias and improve reliability, similar to clinical trials.
- Logistic regression’s role as a standard binary classifier in scientific literature supports its use in machine vision tasks.
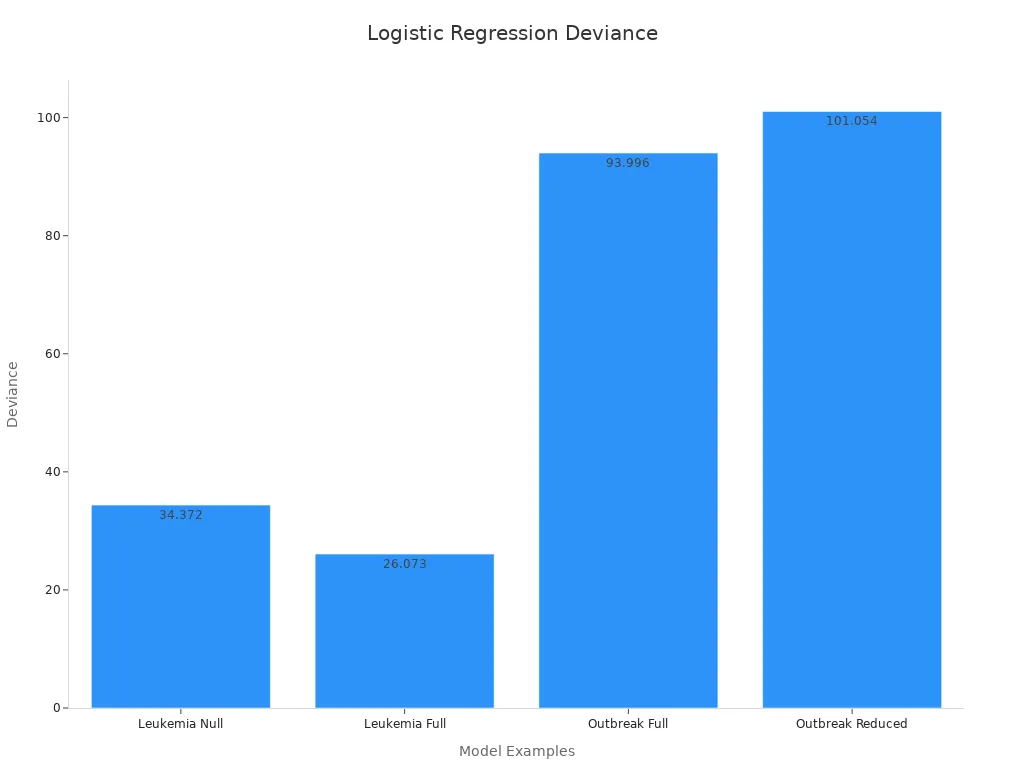
Academic research often uses logistic regression to test the significance of predictors. For example, in studies of leukemia and disease outbreaks, logistic regression analysis helps scientists understand which factors influence outcomes. The chart above shows how deviance changes with different models, supporting the theory behind logistic regression.
Applications in 2025

Object Detection
Object detection stands as one of the most important use cases for machine vision in 2025. Many industries rely on object detection to identify items, people, or obstacles in images and video streams. Logistic regression helps these systems by providing fast and interpretable results, especially when the data has lower dimensions. For example, in warehouse automation, logistic regression models can quickly classify packages as damaged or undamaged based on image features.
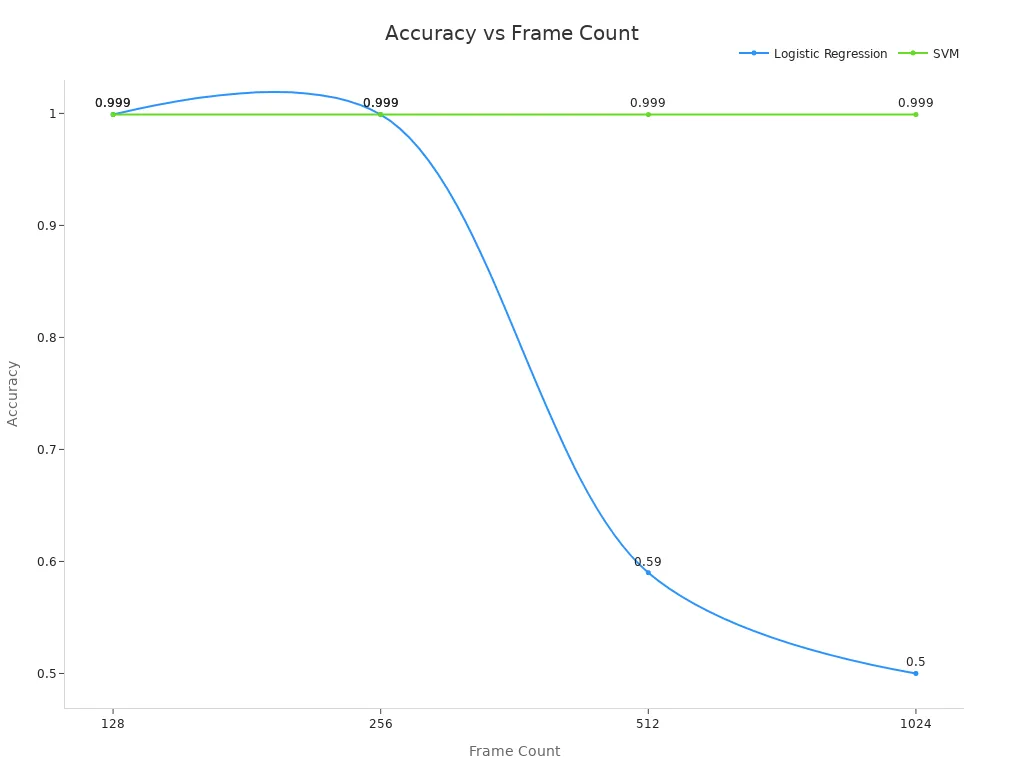
Researchers have compared logistic regression with other machine learning models like SVMs. The table below shows how logistic regression performs at different data sizes:
| Frame Count | Logistic Regression Accuracy | SVM Accuracy | Notes |
|---|---|---|---|
| 128 | 0.999 | 0.999 | Logistic regression performs very well at low dimension |
| 256 | 0.999 | 0.999 | Logistic regression maintains high accuracy |
| 512 | 0.59 | 0.999 | Logistic regression accuracy drops significantly |
| 1024 | 0.5 | 0.999 | Logistic regression fails at high dimension |
Logistic regression works best for object detection when the data is not too complex. It gives high accuracy and fast results for simple use cases, such as sorting objects on a conveyor belt or detecting missing parts in small assemblies.
Quality Control
Quality control in manufacturing uses machine vision to spot defects and ensure products meet standards. Logistic regression models help factories find problems early, which reduces waste and saves money. These models analyze data from high-resolution cameras to detect surface flaws, assembly mistakes, or missing components.
Some key use cases include:
- Detecting scratches or dents on car parts before shipping.
- Checking if electronic boards have all the correct components.
- Monitoring food packaging for leaks or mislabels.
Manufacturers have seen big improvements after using logistic regression in their quality control systems. The table below highlights some important benchmarks:
| Benchmark / Metric | Value | Description |
|---|---|---|
| Decrease in production errors | 27% | Reduction in assembly line production errors after adopting logistic regression assessments. |
| Reduction in vehicle recalls | 15% | Lower recall incidents due to early anomaly detection by logistic regression models. |
| Accuracy in predicting compliance | 85% | Logistic regression models predict regulatory compliance issues with this accuracy. |
| Defect detection rate (machine vision) | 92.64% | Average detection rate of defects using integrated machine vision systems. |
| Misjudgment rate (machine vision) | 6.68% | Rate of false positives or errors in defect detection systems. |
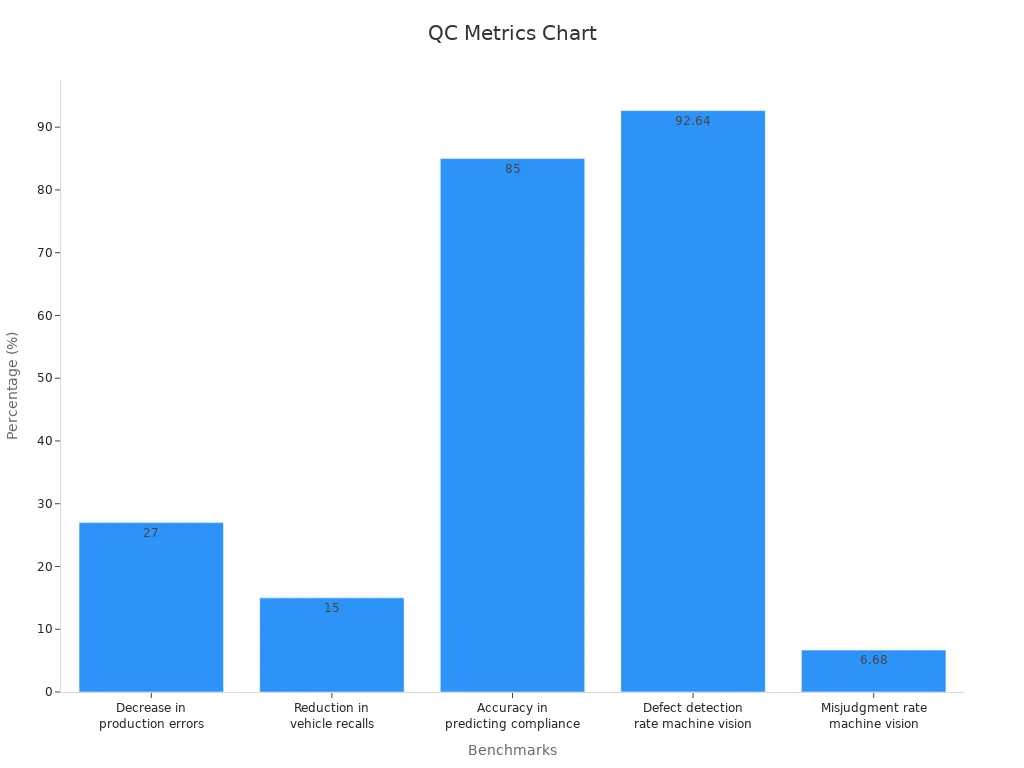
Defect detection systems using logistic regression achieve a 92.64% detection rate and a low misjudgment rate of 6.68%. Companies like BMW and Volvo Trucks use these systems to improve quality and reduce repair times.
Medical Imaging
Medical imaging represents a critical area for machine vision and data science. Hospitals and clinics use logistic regression to help doctors interpret X-rays, MRIs, and CT scans. These models support classification tasks, such as identifying tumors or signs of disease in images.
Researchers have found that logistic regression plays a key role in analyzing large sets of medical data. In one study, logistic regression helped identify sources of variability in diagnostic imaging results. This improved the way doctors understand and trust the results from different hospitals and machines.
| Aspect | Finding | Statistical Evidence | Interpretation |
|---|---|---|---|
| Use of meta-regression (including logistic regression components) | Associated with identification of at least one source of heterogeneity in diagnostic imaging meta-analyses | Odds ratio 1.90; 95% CI 1.11-3.23; P = .02 | Logistic regression helps detect variability sources, improving interpretability of diagnostic accuracy across studies |
| Subgroup analysis (comparison) | No statistically significant association with heterogeneity identification | Odds ratio 1.72; 95% CI 1.02-2.83; P = .05 | Meta-regression (logistic regression based) is more effective than subgroup analysis for heterogeneity assessment |
| Number of meta-analyses included | 242 meta-analyses with median 987 patients each | N/A | Large sample size supports robustness of findings |
| Level of heterogeneity in studies | Moderate to high in 79% of studies | N/A | Highlights the importance of methods like logistic regression to understand heterogeneity |
| Recommendations | Use of logistic regression-based meta-regression is recommended for evaluating heterogeneity in diagnostic imaging DTA studies | N/A | Appropriate statistical methodology including logistic regression improves clinical applicability and interpretation of diagnostic imaging accuracy |
Logistic regression does not always increase the raw accuracy of medical image classification, but it helps doctors and researchers understand why results differ. This leads to better guidelines and more reliable diagnoses.
These use cases show how logistic regression supports machine vision in 2025. It delivers fast, interpretable results for object detection, improves quality control in factories, and helps medical professionals make sense of complex imaging data.
Advantages of Logistic Regression
Interpretability
Logistic regression stands out in machine vision because it is easy to understand. The model uses simple math to show how each feature affects the final decision. Each coefficient in logistic regression tells if a feature increases or decreases the chance of a certain outcome. This clear link between features and results helps people trust the model’s predictions. For example, in a visual classification task, logistic regression can show which image features matter most. Stakeholders can see which factors drive the results, making it easier to improve the system.
Logistic regression’s transparency helps teams find important features and remove less useful ones. This process, called dimensionality reduction, makes models faster and more accurate. The model’s clear structure also helps with debugging and updating features.
The table below compares logistic regression to more complex models:
| Metric | Logistic Regression (Baseline) | Ensemble Methods (Random Forest, XGBoost) |
|---|---|---|
| Recall | Moderate | High |
| Precision | Moderate | Variable |
| F1-Score | Moderate | Higher |
| AUC | Moderate | Superior |
| Interpretability | High | Low |
Logistic regression remains a baseline model because it gives reasonable results and clear explanations. In regulated fields, this interpretability is critical.
Efficiency
Logistic regression is fast and efficient. The model trains quickly, even on computers with limited power. It works well with small datasets and gives results in real time. This speed makes logistic regression a good choice for machine vision tasks that need quick answers, such as emergency medical imaging or factory inspections.
- Logistic regression is simple to build and does not need much technical skill.
- The model uses fewer resources than complex models like XGBoost or Random Forest.
- It works well in places with limited computer power, such as small clinics or mobile devices.
- Logistic regression often covers about 90% of the performance needed for many tasks.
While advanced models may offer higher accuracy, they require more time and resources. Logistic regression provides a strong starting point for testing ideas and comparing new models.
Limitations and Comparison
Scalability Issues
Logistic regression works well with small and medium-sized image datasets. When the data grows larger or becomes more complex, this algorithm starts to show its limits. The model struggles to capture patterns in high-dimensional data, especially when images have many features. Studies show that logistic regression achieves accuracy scores of about 72 to 80.5 on large image datasets, while neural networks reach up to 89. This gap highlights the challenge of scaling logistic regression for advanced machine vision tasks. As the number of features increases, the model may also require more memory and time, making it less practical for very large data projects.
| Class Balancing Method | Logistic Regression Accuracy | Neural Network Accuracy | Gradient Boosting Accuracy |
|---|---|---|---|
| IB | 72 | 82 | 80 |
| D-GA | 80 | 88 | 87 |
| D-PO | 80.5 | 89 | 87 |
Deep Learning vs. Logistic Regression
Deep learning models, such as neural networks, often outperform logistic regression on complex image tasks. In one study, neural networks and random forests achieved higher AUROC scores than logistic regression when using many features. For example, with 1667 features, neural networks reached an AUROC of 0.78, while logistic regression scored 0.66. However, deep learning does not always win. On some machine vision tasks, logistic regression outperformed deep learning models like ResNet and DenseNet in F1 score and balanced accuracy. This result shows that logistic regression can still be the best choice when the data is simple or when the dataset is small.
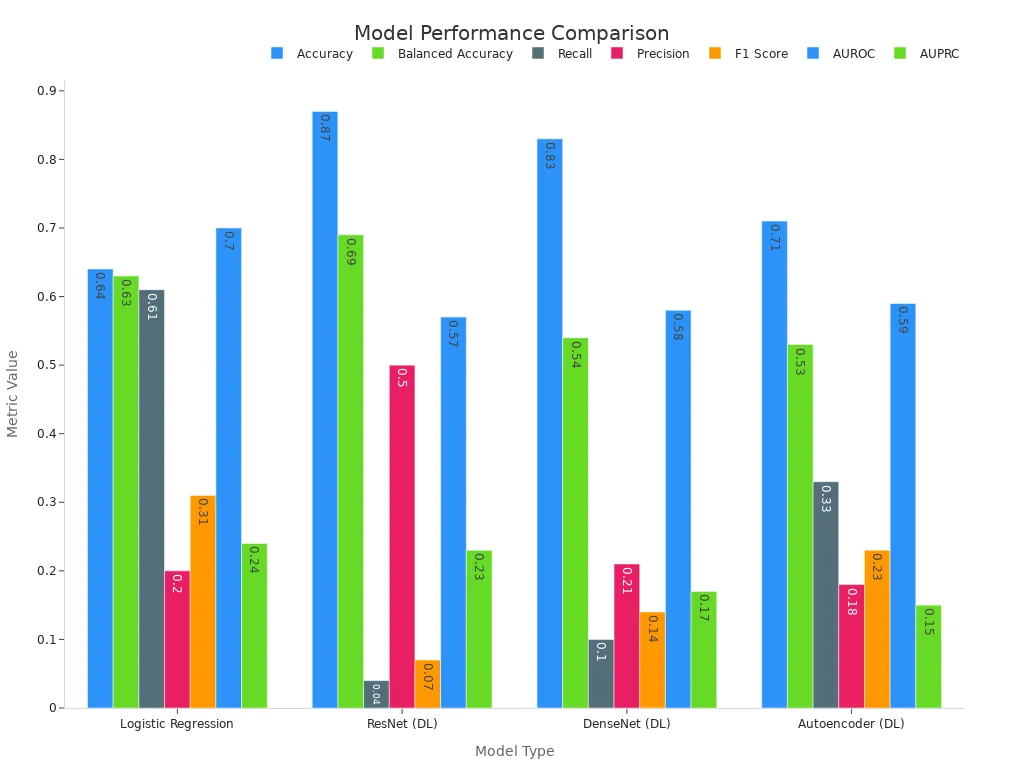
Deep learning models need more data and computing power. Logistic regression remains a strong baseline, especially when interpretability and speed matter most.
SVMs and Decision Trees
Support vector machines (SVMs) and decision trees are other popular machine learning algorithms for image classification. Benchmarking studies show that SVMs often achieve higher accuracy and F1-scores than logistic regression, but they require more computing resources. Decision trees and logistic regression both train quickly and use less memory. However, decision trees can handle more complex data patterns. Researchers found that tree-based models often outperform deep learning and logistic regression on tabular data. SVMs work well for high-dimensional data but may slow down with very large datasets.
Logistic regression and decision trees are fast and easy to use. SVMs offer better accuracy for some tasks but need more time and power. Choosing the right model depends on the size and type of data.
Best Practices and Trends
Implementation Tips
Deploying logistic regression in machine vision systems requires careful planning and attention to detail. Teams can follow these tips to achieve reliable results:
- Tune the regularization parameter C by testing values from 0.001 to 1000. Start with a wide range, then focus on the best area to avoid overfitting or underfitting.
- Choose the solver based on the size and type of data. Use liblinear for small or sparse datasets, lbfgs for medium or large dense datasets, and saga for very large or elastic net problems.
- Standardize features using tools like StandardScaler. This step helps logistic regression models converge faster and perform better.
- Apply cross-validation, such as 5- or 10-fold splits, to check model stability and reduce the risk of overfitting.
- Address imbalanced data by setting class_weight=’balanced’ or using custom weights. This improves predictions for rare classes.
- Evaluate models with metrics beyond accuracy, like F1-score, precision, and recall. These metrics matter most when classes are not balanced.
- Inspect learning and validation curves after tuning. This helps confirm that the model is not too simple or too complex.
- For multiclass problems, use One-vs-Rest or multinomial logistic regression strategies.
- Add new features, such as polynomial or interaction terms, to help the model handle non-linear relationships.
- Increase max_iter or adjust solver and C if the model does not converge.
Teams should also use diverse and representative data to avoid bias. Regular monitoring and transparent documentation help prevent silent failures and support fairness in science and data science projects.
Future Directions
In 2025, logistic regression continues to play a key role in machine vision, especially for use cases with small datasets or mostly linear relationships. Research shows that logistic regression often matches or outperforms more complex models when data is limited. For example, a study found that logistic regression achieved the highest AUC of 0.75 for osteoporosis prediction using only nine variables. This result highlights the model’s strength in clinical and industrial settings.
Machine vision teams face new challenges, such as the need for external validation and ongoing monitoring. Regulatory approval does not guarantee fairness or robustness. Teams must involve experts from different fields and perform regular audits to catch bias or drift in the data. As machine vision systems grow, logistic regression will remain a reliable choice for interpretable and robust predictions, especially when data science projects require transparency.
Logistic regression remains a trusted choice for machine vision in 2025. Studies show its interpretability and efficiency make it valuable for binary and multiclass tasks. While advanced models like decision trees and random forests offer slightly higher accuracy, logistic regression provides clear results and fast computation.
Researchers recommend exploring hybrid approaches and tuning models for better results. Teams should consider project needs, as logistic regression often matches more complex models in performance.
FAQ
What is logistic regression used for in machine vision?
Logistic regression helps computers decide if something is present in an image. For example, it can tell if a picture shows a cat or not. Many factories and hospitals use it for quick and clear decisions.
How does logistic regression compare to deep learning?
Logistic regression works well with simple data and gives fast results. Deep learning handles more complex images and often finds more patterns. Logistic regression is easier to understand, while deep learning needs more computer power.
Can logistic regression handle more than two classes?
Yes. Logistic regression can use special methods like multinomial or One-vs-Rest. These methods let the model sort images into many groups, not just two.
Why do experts trust logistic regression results?
Experts trust logistic regression because it shows how each feature affects the outcome. The model’s math is simple. People can see which parts of the image matter most for the decision.
See Also
Advancements In Machine Vision Segmentation Technologies By 2025
Emerging Trends In Component Counting Vision Systems For 2025
Understanding Logistics And Its Influence On Machine Vision Systems
A Comprehensive Guide To Computer And Machine Vision Models
Exploring Predictive Maintenance Using Machine Vision Technologies